Prometheus monitoring
1. About
The following components deploy a Grafana, Prometheus server, node exporters, and alert managers on the VMs:
Grafana automatically adds Prometheus server as its data source.
Prometheus server automatically scrapes metrics from new node exporters, sends alerts to alert manager endpoints, as well as monitors Grafana and alertmanager endpoints.
Security groups for TCP connections between components are auto-created.
All connections between Grafana, Prometheus server, and node exporters are TLS protected with basic authentication (self-signed certificate and auto-generated password).
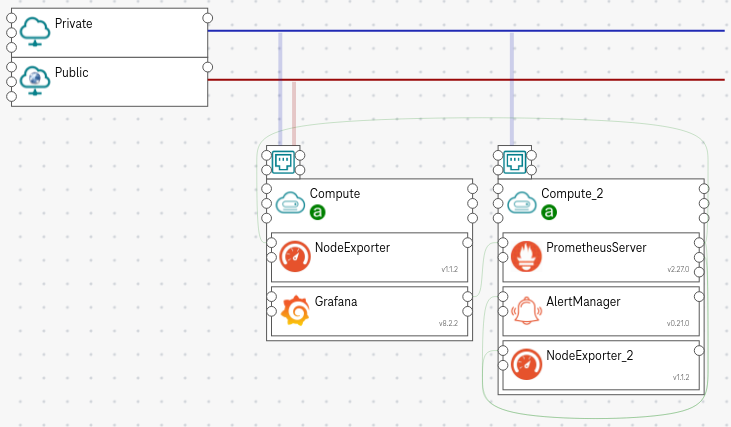
Figure 1. Prometheus example
Tip
You can use the exiting template Prometheus Monitoring to create the above topology.
2. How to use
2.1. How to scrape metrics from a node exporter
Put the component PrometheusServer on a compute node, where you want to deploy the Prometheus server.
Put the component NodeExporter on any compute nodes, where you want to scrape the metrics. The PrometheusServer and NodeExporter can be on different compute nodes.
Connect the scrape_metrics_from_node_exporters (on the right of the PrometheusServer) to the scrape_endpoint (on the left of the NodeExporter).
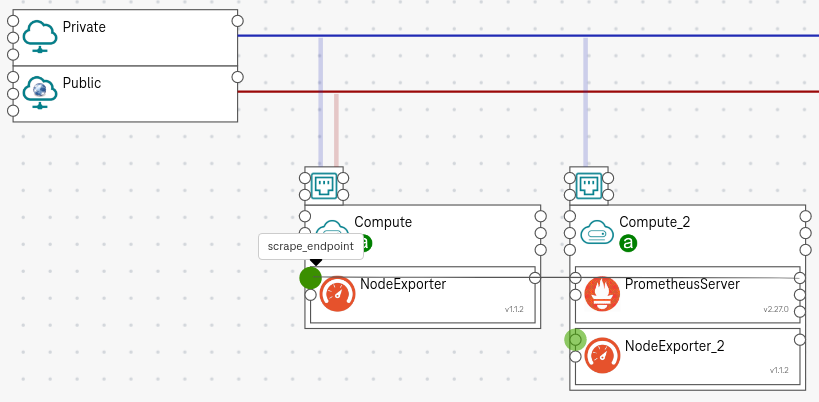
Figure 2. How to scrape metrics
Set a version (optional)
To customize which Prometheus version to deploy, click on the PrometheusServer / Set the component_version property (e.g.,
2.27.0)
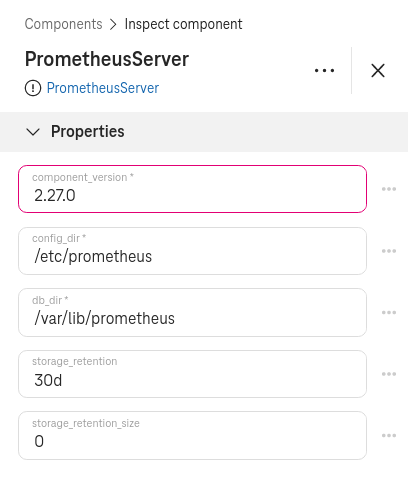
Figure 3. How to set the Prometheus version
Set the metrics (optional)
To customize the exported metrics, click on the NodeExporter / Set enabled_collectors properties.
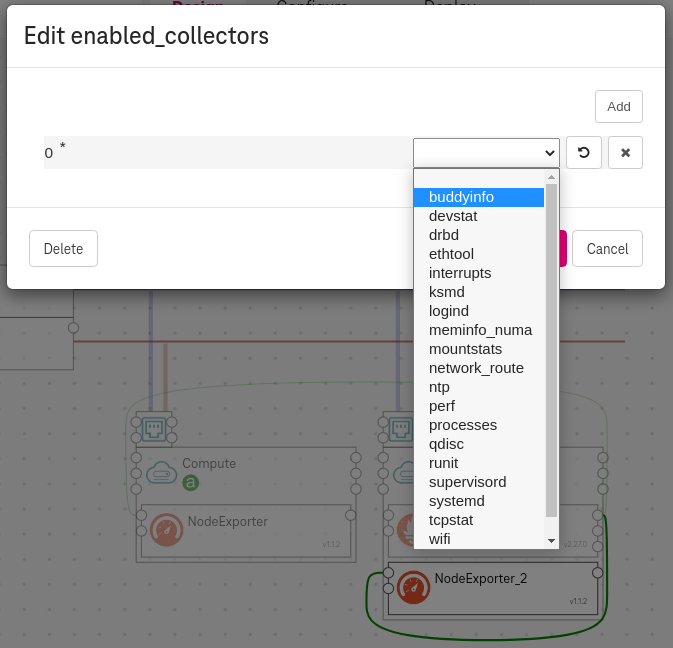
Figure 4. How to export metrics
See also
By default, node exporters enable the following collectors.
Set the disabled_collectors properties to disable the default ones.
2.2. How to add an Alertmanager to Prometheus
Put the component AlertManager on a compute node, where you want to deploy the Alertmanager.
Connect the add_alert_managers (on the right of PrometheusServer) to the alertmanager_endpoint (on the left of the AlertManager).
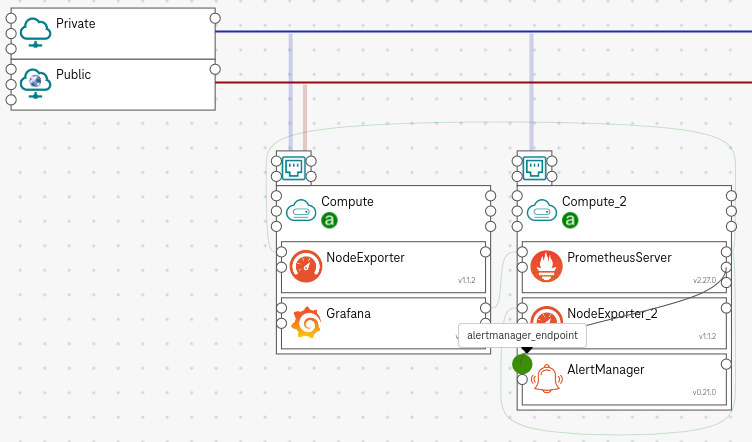
Figure 5. How to add an alert manager
Set a root route
The Alert Manager requires a root route set with a default receiver.
To set the root route, click on the AlertManager / Set the Route properties (e.g., Set
slackin theReceiverfield).
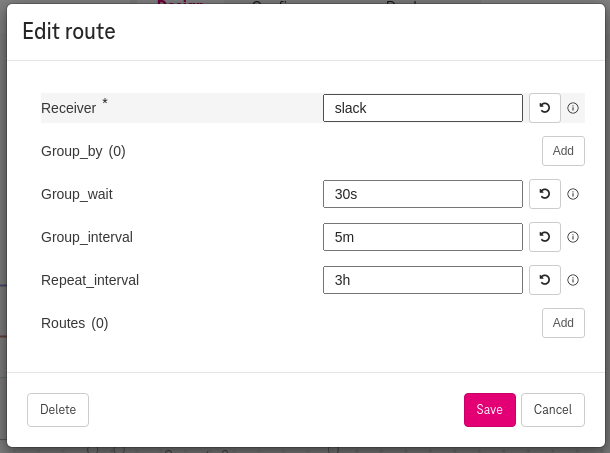
Figure 6. How to add route for the alert manager
Set receivers
To add a receiver, click the Receivers properties (e.g., Set
slackas the receiverName).To add a slack receiver, click slack_configs and set the required fields
api_urlandchannel.
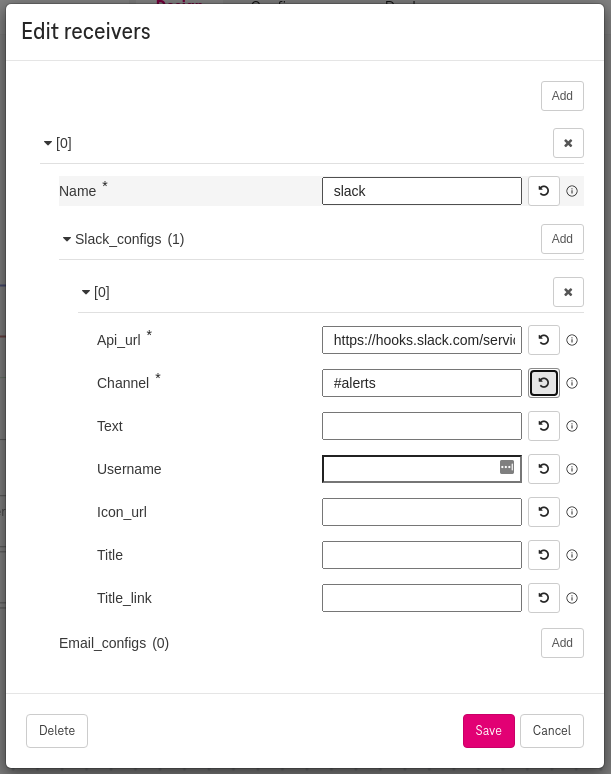
Figure 7. How to add receiver for the alert manager
Alternatively, to add an email receiver (e.g., gmail) click the email_configs (and do not use the slack_configs). Here is an example with gmail:
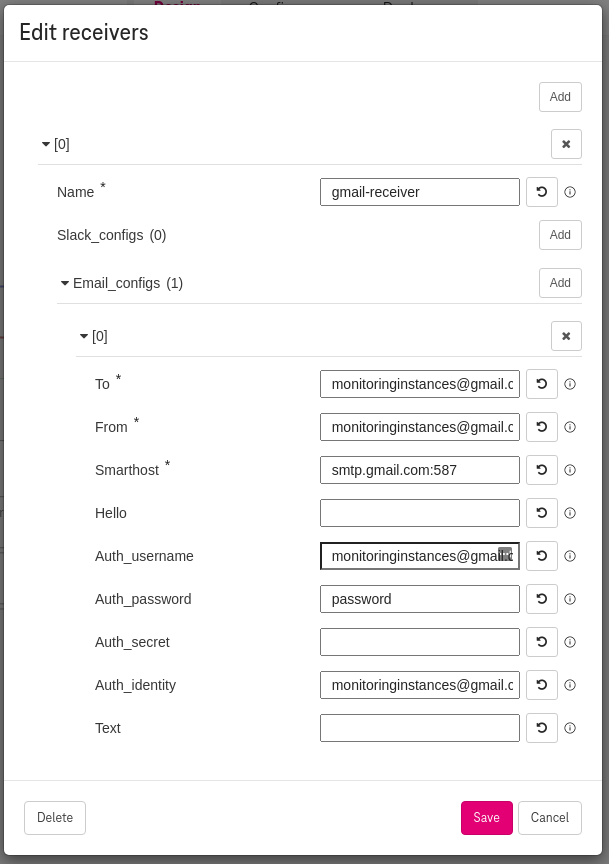
Figure 8. How to add gmail receiver for the alert manager
Tip
The fields route, slack_configs, and email_configs are the same configs as in the Alert manager official documentation.
2.3. How to add the Grafana dashboard
Put the component Grafana on a compute node, where you want to deploy the dashboard (e.g., we put it on a public compute so that we can access it via floating IP).
Connect the add_datasource_prometheus (on the right of Grafana) to the prometheus_endpoint (on the left of the PrometheusServer).
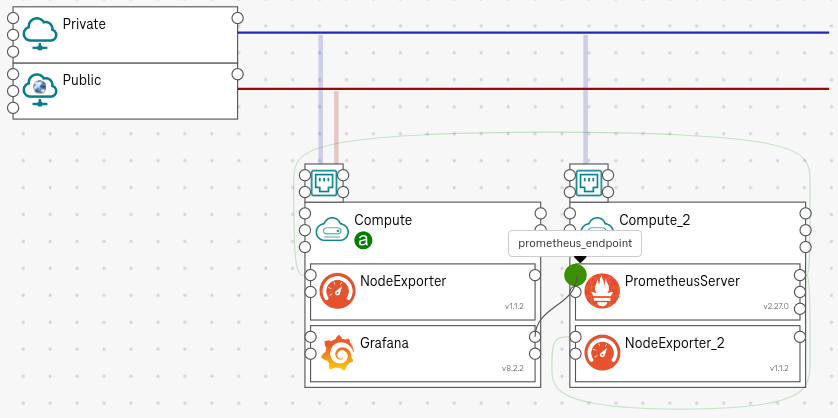
Figure 9. How to add Grafana
Set the admin user (optional)
To set the admin user (on first login), click on the Security properties / Set the
admin_userandadmin_passwordfields. By default, it is set toadmin/admin.
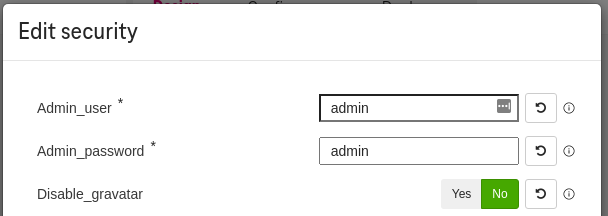
Figure 10. How to customize admin user
Set the TLS certificates (optional)
By default, we protect Grafana endpoint with TLS using an auto-generated self-signed certificate.
To provide your own certificate, set the Server properties / Set the fields
cert_keyandcert_fileto the corresponding paths on the VM.
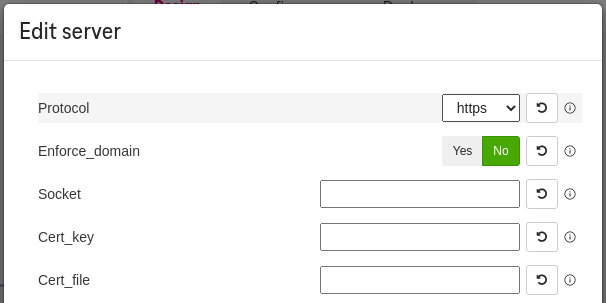
Figure 11. How to customize certificate
2.4. Set output attributes
(Optional) Tick the attributes
public_urlof the Grafana component.
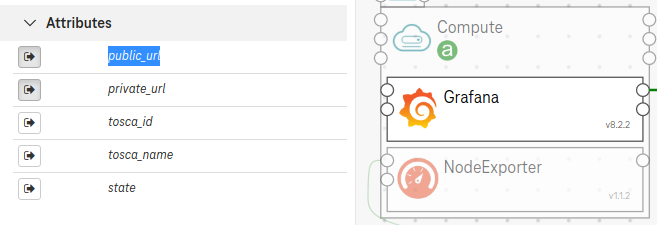
Figure 12. Set output attributes
3. Expected result
3.1. Access Grafana
After the deployment completes, click on the output
public_urlto access Grafana via a browser.
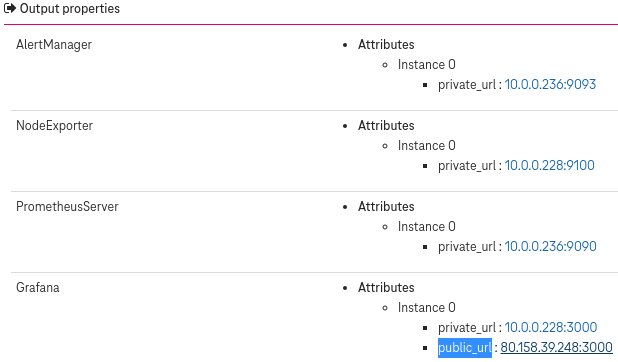
Figure 13. Set output attributes
Use the Grafana admin credentials set above to access the dashboard (e.g.,
admin/admin).
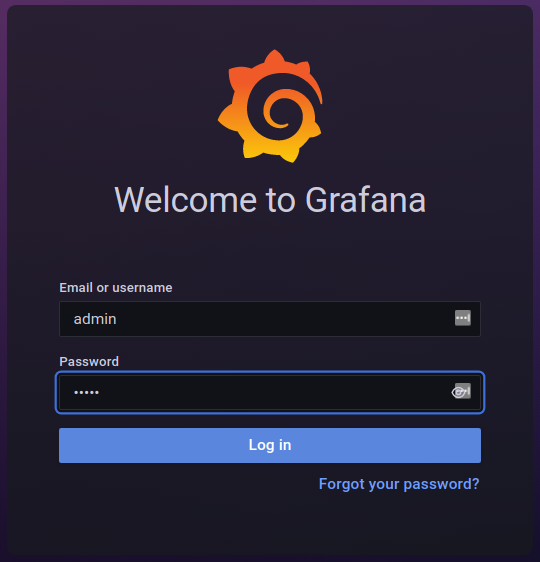
Figure 14. Access grafana
3.2. Show the Grafana datasource
Under Data Sources / Prometheus, you can see that the Prometheus endpoint is added.
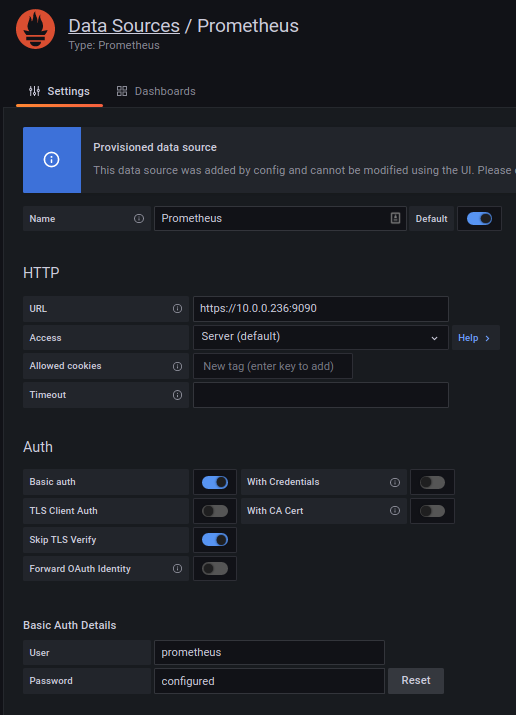
Figure 15. Grafana datasource
Tip
Click the Test button to check the connection between Grafana and Prometheus server.
3.3. Show the metrics in the dashboard
You can add a new Dashboard and query metrics (e.g., show the metric
upfrom a node exporter)
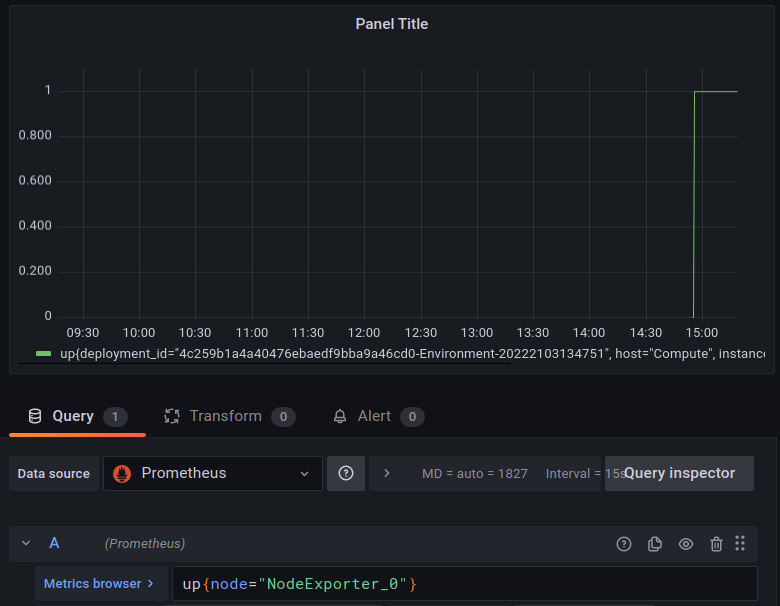
Figure 16. Grafana metrics
3.4. Show node exporter configs
All node exporters are auto-protected with TLS (using a self-signed certificate) and basic authentication:
# cat /etc/node_exporter/config.yaml

tls_server_config:
  cert_file: /etc/node_exporter/tls.cert
  key_file: /etc/node_exporter/tls.key
basic_auth_users:
  prometheus: PASSWORD_HASH
3.5. Show Prometheus configs
Prometheus is auto-protected with TLS (using a self-signed certificate) and basic authentication:
# cat /etc/prometheus/web.yml

basic_auth_users:
  prometheus: PASSWORD_HASH
tls_server_config:
  cert_file: /etc/prometheus/tls.cert
  key_file: /etc/prometheus/tls.key
Prometheus scrapes metrics from the node exporter:
# cat /etc/prometheus/prometheus.yml

scrape_configs:
  - basic_auth:
      password: AUTO_GENERATED_PASSWORD
      username: prometheus
    file_sd_configs:
    - files:
      - /etc/prometheus/file_sd/node.yml
    job_name: node
    scheme: https
    tls_config:
      ca_file: /etc/prometheus/ca.cert
It also scrapes metrics from Prometheus itself:
- basic_auth:
    password: AUTO_GENERATED_PASSWORD
    username: prometheus
  job_name: prometheus
  metrics_path: /metrics
  scheme: https
  static_configs:
  - targets:
    - PrometheusServer:9090
  tls_config:
    ca_file: /etc/prometheus/ca.cert
It monitors Grafana and Alertmanager endpoint as well:
- file_sd_configs:
  - files:
    - /etc/prometheus/file_sd/grafana.yml
  job_name: grafana
  scheme: https
  tls_config:
    insecure_skip_verify: true

- file_sd_configs:
  - files:
    - /etc/prometheus/file_sd/alertmanager.yml
  job_name: alertmanager
Prometheus sends alerts to the Alertmanager endpoint:
alerting:
  alertmanagers:
  - scheme: http
    static_configs:
    - targets:
      - AlertManager_0:9093
3.6. Show Alert manager configs
Alertmanager is configured with the receiver and the root route slack:
# cat /etc/alertmanager/alertmanager.yml

receivers:
- name: slack
  ...
route:
  group_by:
  - alertname
  - cluster
  - service
  group_interval: 5m
  group_wait: 30s
  receiver: slack
  repeat_interval: 3h
3.7. Security group notes
The orchestration engine auto-generates the following security groups:
Public access (
0.0.0.0/0) to Grafana on port3000.Internal access from Grafana to Prometheus on port
9090.Internal access from Prometheus to node exporters on port
9100.Internal access from Prometheus to alert manager on port
9093.