Introduction
Enterprise Dashboard is a web-based dashboard providing access to billing data. It allows to check spendings for Open Telekom Cloud infrastructure. It comes with dedicated views for specific domains and their cost drivers.
To enter the Enterprise Dashboard Service, you need to enter your credentials. Your email and password are required. You will receive an invitation for Enterprise Dashboard, once the order is confirmed and processed. With this invitation, you can set the password of your user account.
Your email and password are case-sensitive. Please check upper and lower cases before clicking Log In.
Note
Enterprise Dashboard is offered via Direct sales or eShop. Please contact either your contractual partner to set up your access or contact Request-OpenTelekomCloud@telekom.de. It can be booked just as other additional services, e.g. reserved packges.
Monitor Spendings on a Businesspartner Level
It will also allow you to monitor your spendings on a businesspartner level. This means that all costs for each of your tenants assigned to you as a businesspartner are visible within one Dashboard.
Visualization with Grafana
Grafana 9.0.4 is currently used to render the monitored data. Feel free to check the documentation of Grafana as well, if you’re missing certain functionalities within this user manual. Please check the following link:
Product versions
Enterprise Dashboard is available in three versions.
Product Versions | API Access | Dashboard Self Service | Multi Tenant | Organization Management |
|---|---|---|---|---|
Enterprise Dashboard Small | x | x | ||
Enterprise Dashboard Medium | x | x | ||
Enterprise Dashboard Large | x | x | x | x |
The product feature API access gives you access to all API calls described in chapter “API”.
The product feature Dashboard Self Service gives you the option to create “Admin” or “Editor” users, which are allowed to create dashboards, widgets, alerts, or users by themselves. Some examples are described in the Chapter “How to”.
The product feature Multi-Tenant gives you access to a global dashboard, which aggregates all spendings across several tenants. This allows you to manage your business on a bigger scale.
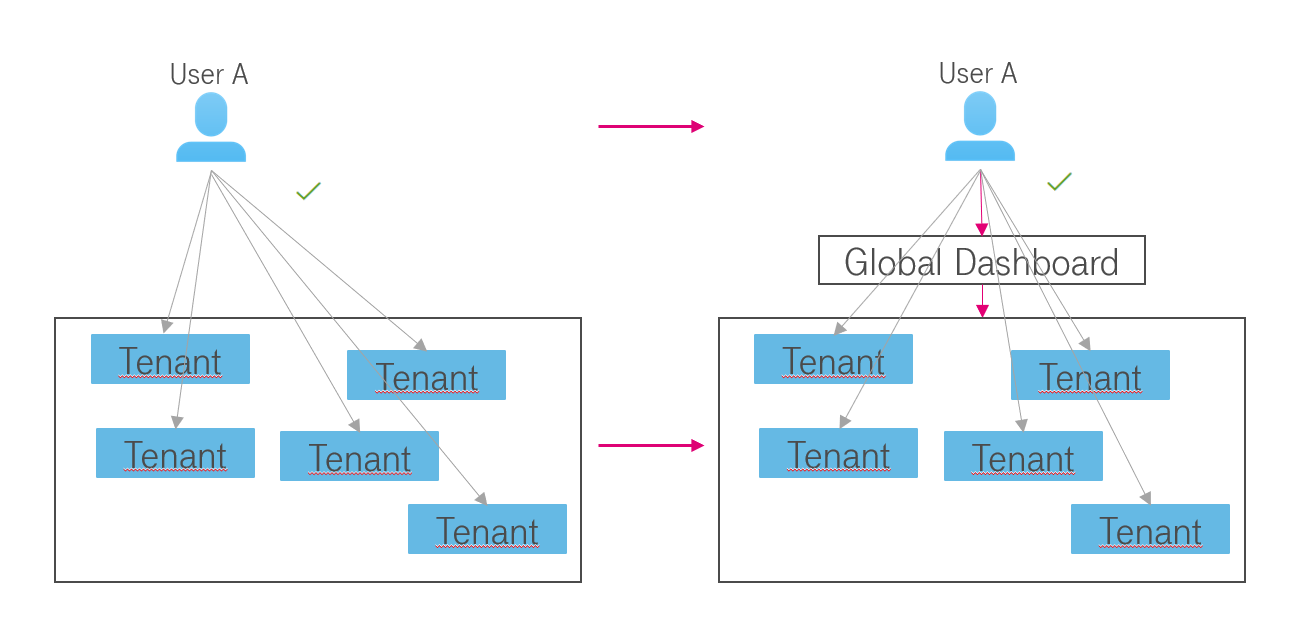
In a scenario like the above, it gets very hard for User A to compare data from multiple tenants. Each of his tenants has only access to the data of the own tenant. To compare data he needs a global dashboard, which allows him to access and compare data of all tenants in one organization. Also from a financial perspective, it’s recommended to consume Enterprise Dashboard Large instead of multiple Enterprise Dashboard Medium.
The product feature Organizations Management helps you to easily manage access to your dashboards and data. It allows you to split your payer account (see chapter 2.4) into smaller parts with separate global dashboards. This allows you to move certain tenants into a new completely separated organization with new users, user groups, and dashboards.
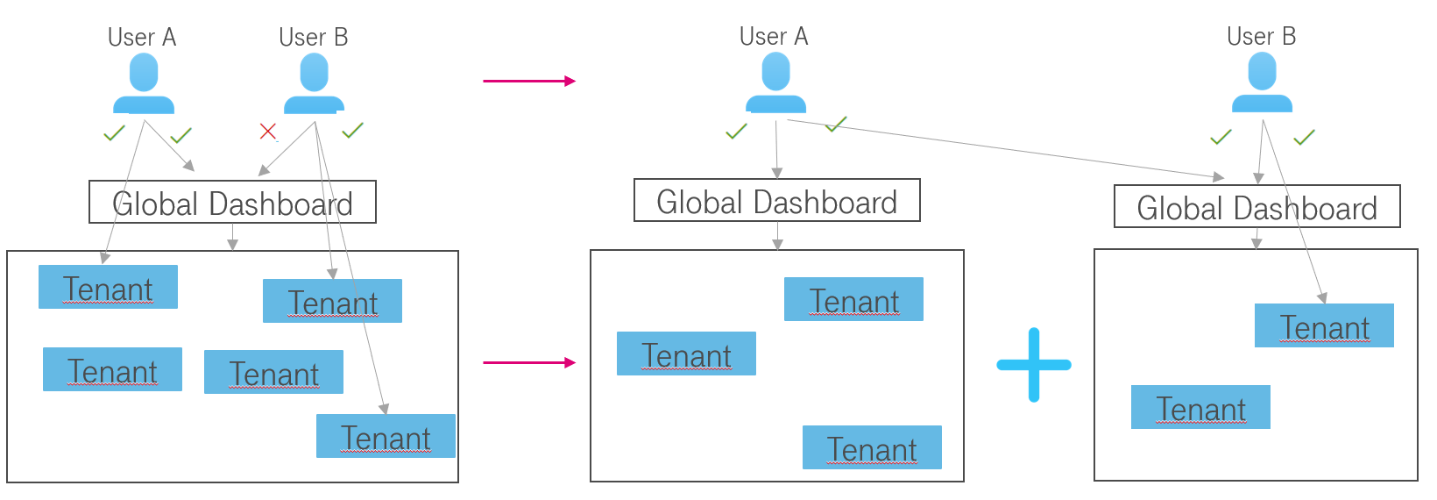
In a scenario like above, where User B is not allowed to access certain tenants, you can separate those tenants and give User B access to that organization and therefore access to the global dashboard.
API
Most functionality of the Enterprise Dashboard is also available via an REST HTTP endpoint for integration in other applications. Please refer to the Enterprise Dashboard API Reference.