How to
Warning
There is a bug in grafana (see https://github.com/grafana/grafana/pull/61927) which doesn't let you edit queries anymore. To solve this problem you need to go to the datasource, select the same datasource again and then the query editor should appear again.
Switch Organizations
You can switch your organizations by navigating to the bottom left of your screen. If you’re allowed to see more than one organization, you will see your currently selected organization at the top. After clicking the “Switch” Button a new pop-up menu will appear, where you can select another organization/tenant.
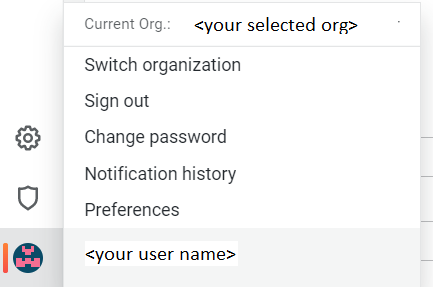
This functionality is available for each user with more than one organization assigned to them.
Access Dashboards
Make sure the right organization is selected. You need to select the global dashboard to have an overview of multiple contracts or a contract-specific dashboard if you want to have the data of one specific contract.
The name of a businesspartner organization follows the pattern "00000XXXX <org name>".
The name of a contract organization follows the pattern "10000XXXXX".
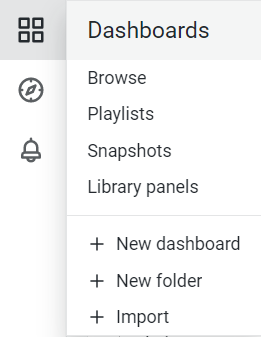
You can access the dashboards of your organization by clicking Manage within the “Square”-Symbol in the navigation bar on the left side of the screen.
“Getting started”-Dashboard
Each organization includes a so-called “Getting Started” dashboard, which contains some information relevant to new users of Enterprise Dashboard. For example, all of your dashboards are listed, new releases from Open Telekom Cloud are visible and some basic user permissions are explained.
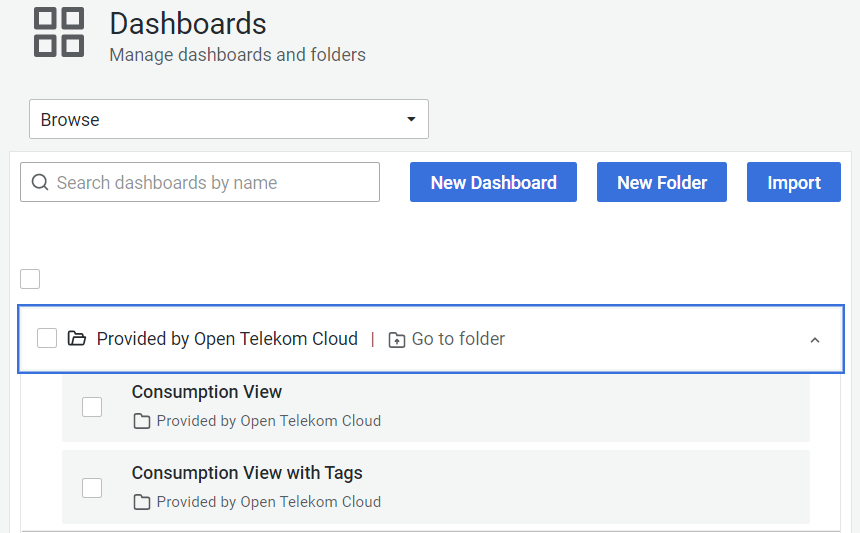
Provided by Open Telekom Cloud
There are two default consumption dashboards within each organization. Dashboards provided by Open Telekom Cloud are located in the folder “Provided by Open Telekom Cloud”.
Consumption view (Hourly/Daily)
The Dashboard “Consumption view” aims to display your spendings according to your monthly invoice. It focuses on attributes, which are visible on the pdf file of your invoice, e.g. spendings of individual product categories and products.
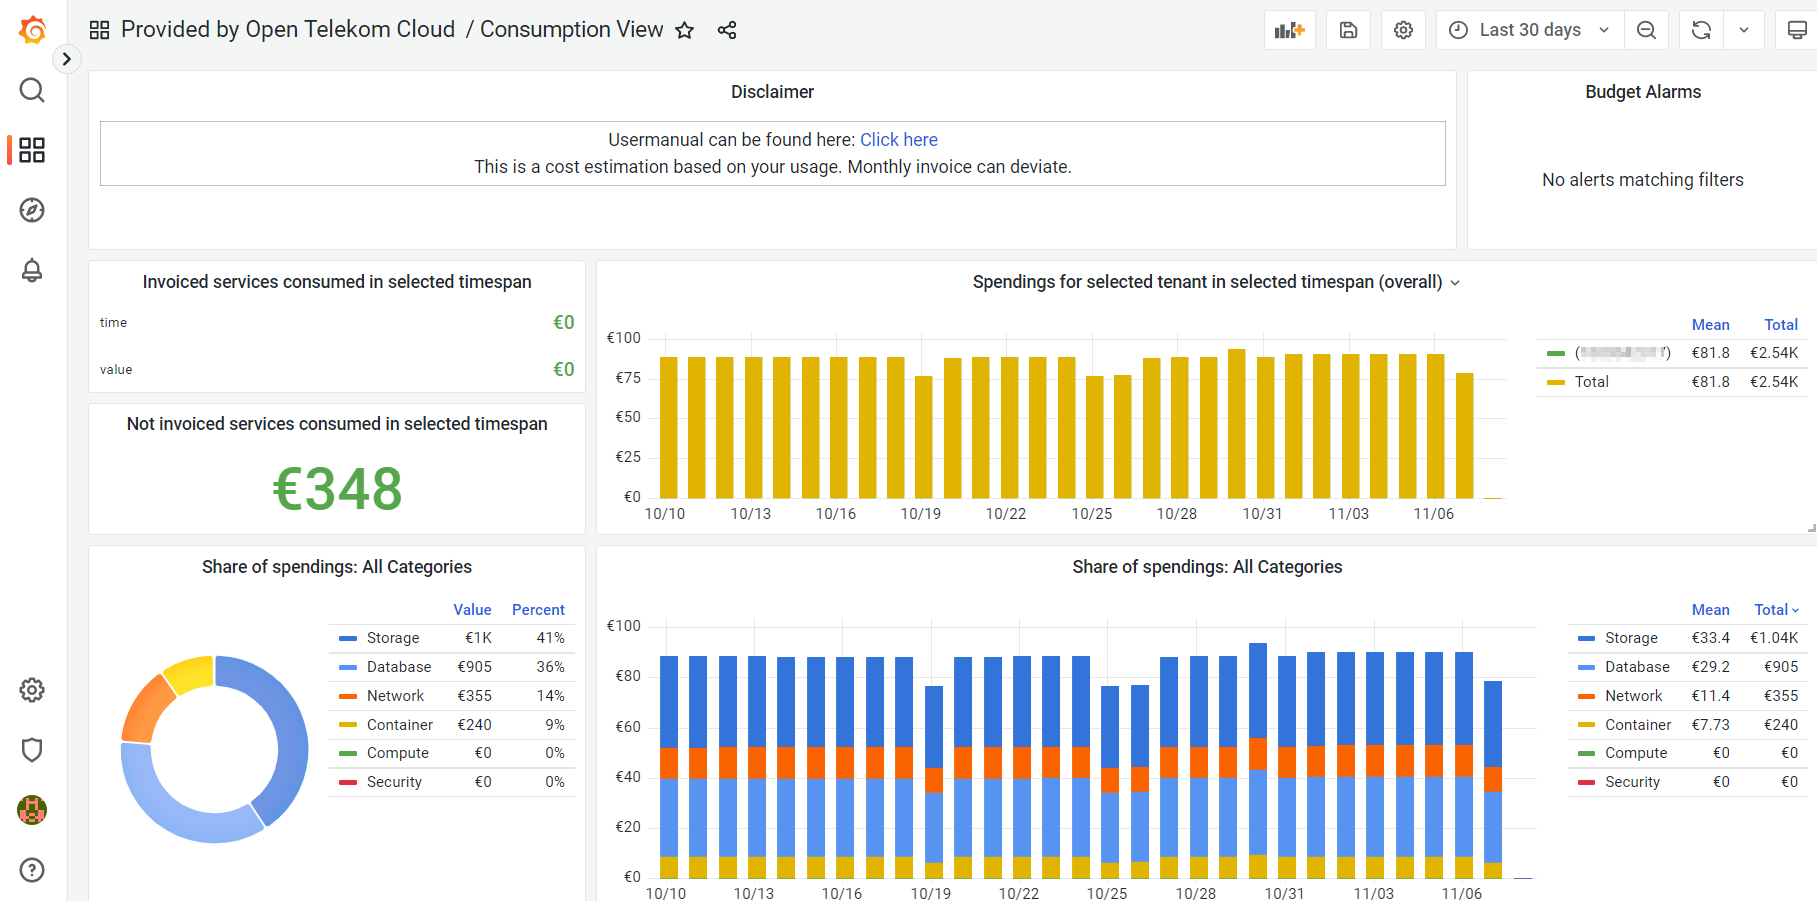
You will see your aggregated costs already in the first panels of the dashboards and will get more detailed views for individual product categories or projects further below.
This dashboard is available in hourly and daily data granularity.
Consumption view with Tags (Hourly/Daily)
The Dashboard “Consumption view with Tags” displays your invoice data with a focus on those resources, which have been tagged. Tag Management Service is an Openstack Service that allows the user to add up to 20 additional metadata tags to a virtual machine or data disk (and several other resources). The cost of these machines is visible in the CSV file of your invoice.
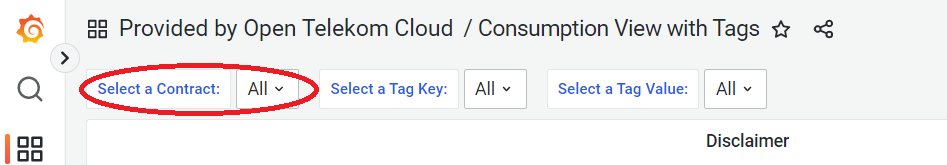
You can select either specific Tag Key and Value combinations or display all of them.
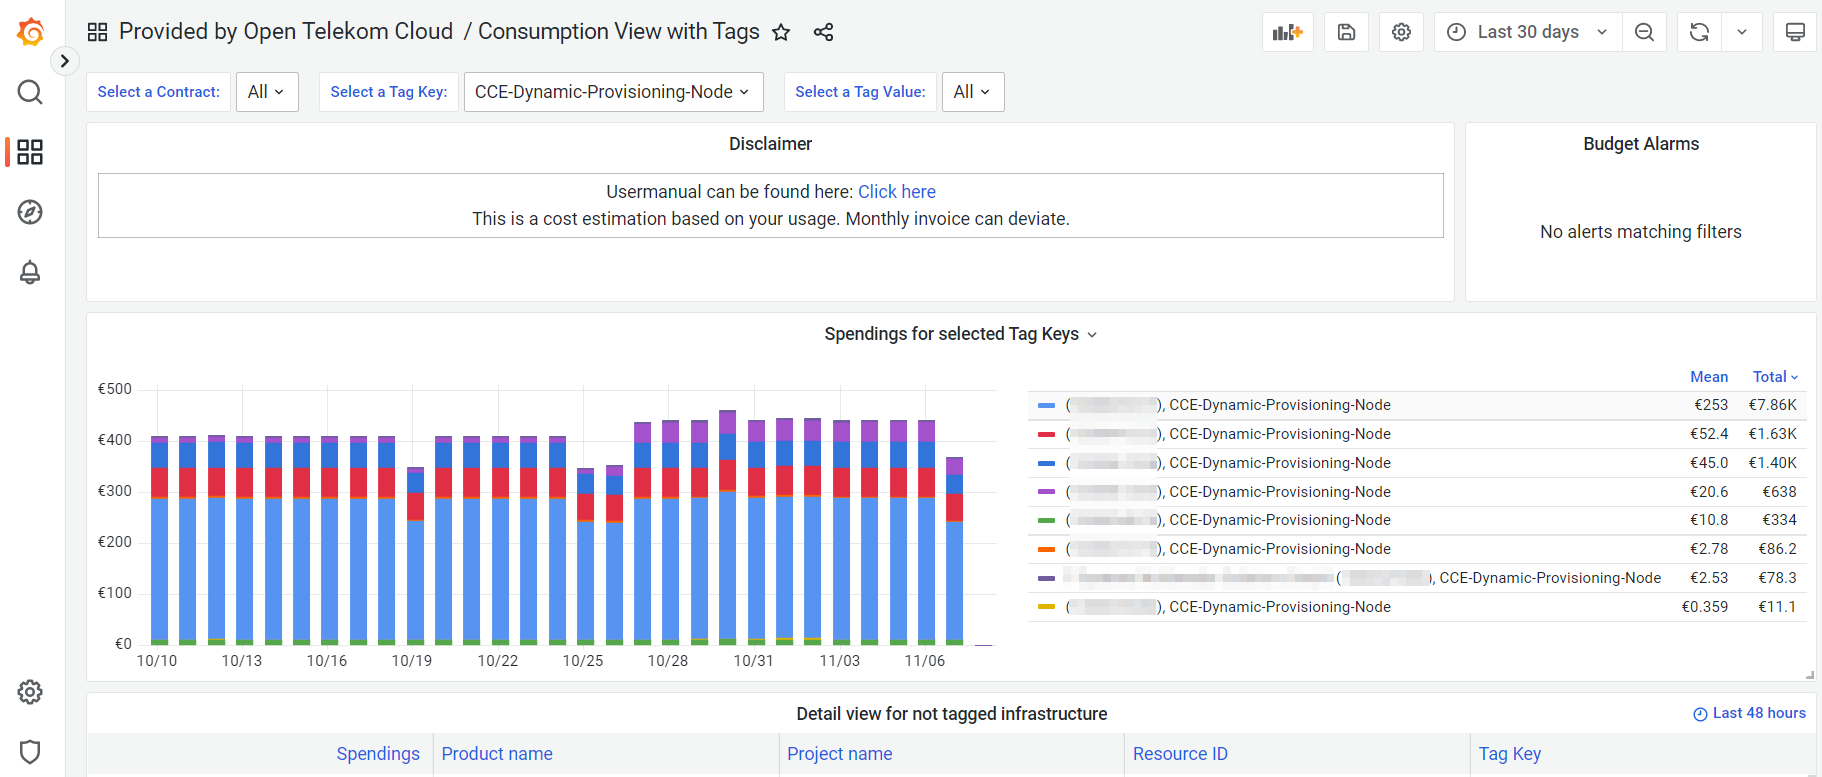
For example, you can select the Tag Key “CCE-Dynamic-Provisioning-Node” to see your Container Costs within Open Telekom Cloud. Elastic Cloud Servers spawned within a Cloud Container Engine Node have this Key-Value Pair attached to it.

According to your selection, the dashboard panels will display the costs accordingly.
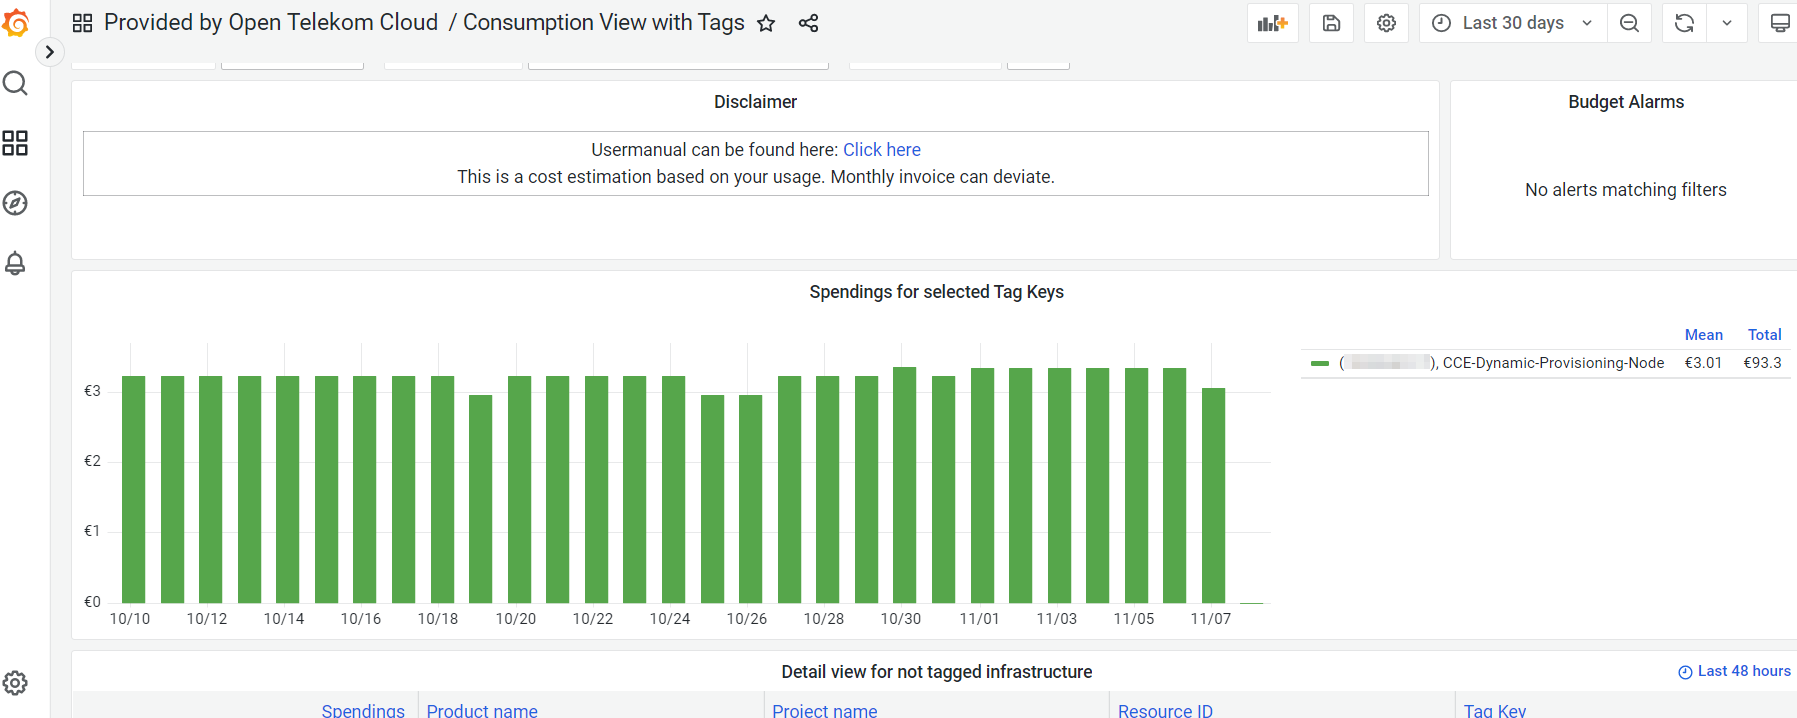
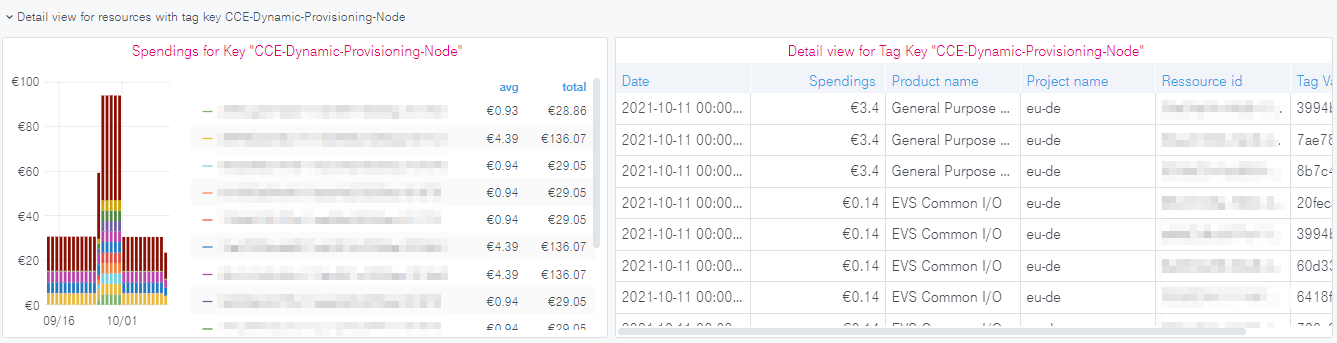
More detailed views for each selected Tag Key-Value combinations can be found further below in the dashboard.
This dashboard is available in hourly and daily data granularity.
Business Partner consumption view (Hourly/Daily)
Business Partner Dashboards are available for users of Enterprise Dashboard Large.
The dashboard “Consumption view” for business partner is built up in the same way as the dashboard “Consumption view” described in chapter 3.2.3 before. However, there is one exception. You can select either a single, multiple, or all contracts of your business partner with a selection box in the first row of the dashboard. If you select just one contract you will have the same view as the contract organization with its consumption view. If you select more than 1 contract, each widget will include the costs of the selected Tenants. In the following you will see a screenshot of the mentioned selection box:
This dashboard is available in hourly and daily data granularity.
Business Partner consumption view with Tags (Hourly/Daily)
Business Partner are available for users of Enterprise Dashboard Large.
The dashboard “Global consumption view with tags” is built up in the same way as the dashboard “Consumption view with tags”. Similar to the other global dashboard before, you can select single, multiple, or all tenants here as well. The spending for the tagged infrastructure of the selected tenants will be shown.
For example, this allows you to observe the spending of Cloud Container Engine, already mentioned in Chapter 3.2.4, but across all your tenants, see screenshot below:
This dashboard is available in hourly and daily data granularity.
Alerts
Grafana provides built-in alerting functionalities. Please note that alerts on OTC provided Dashboard are deleted once the dashboard gets an update. We recommend creating copies of the widgets you want to monitor in a new dashboard and/or folder.
In the following, you will find a short introduction, how you can set up an alert on your dashboard. Please note that this functionality is only available for Editor or Admin Users. The complete description can be found here:
New updates in alert can be found on this page:
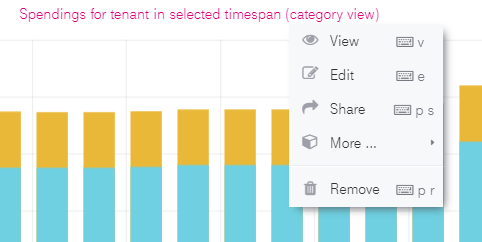
Enter the widget editor by clicking “Edit”. Click on the name of a widget to toggle the menu shown in the following screenshot:
or launch from the side panel
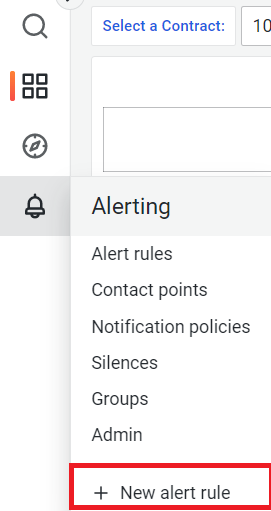
You will be forwarded to the alert page.
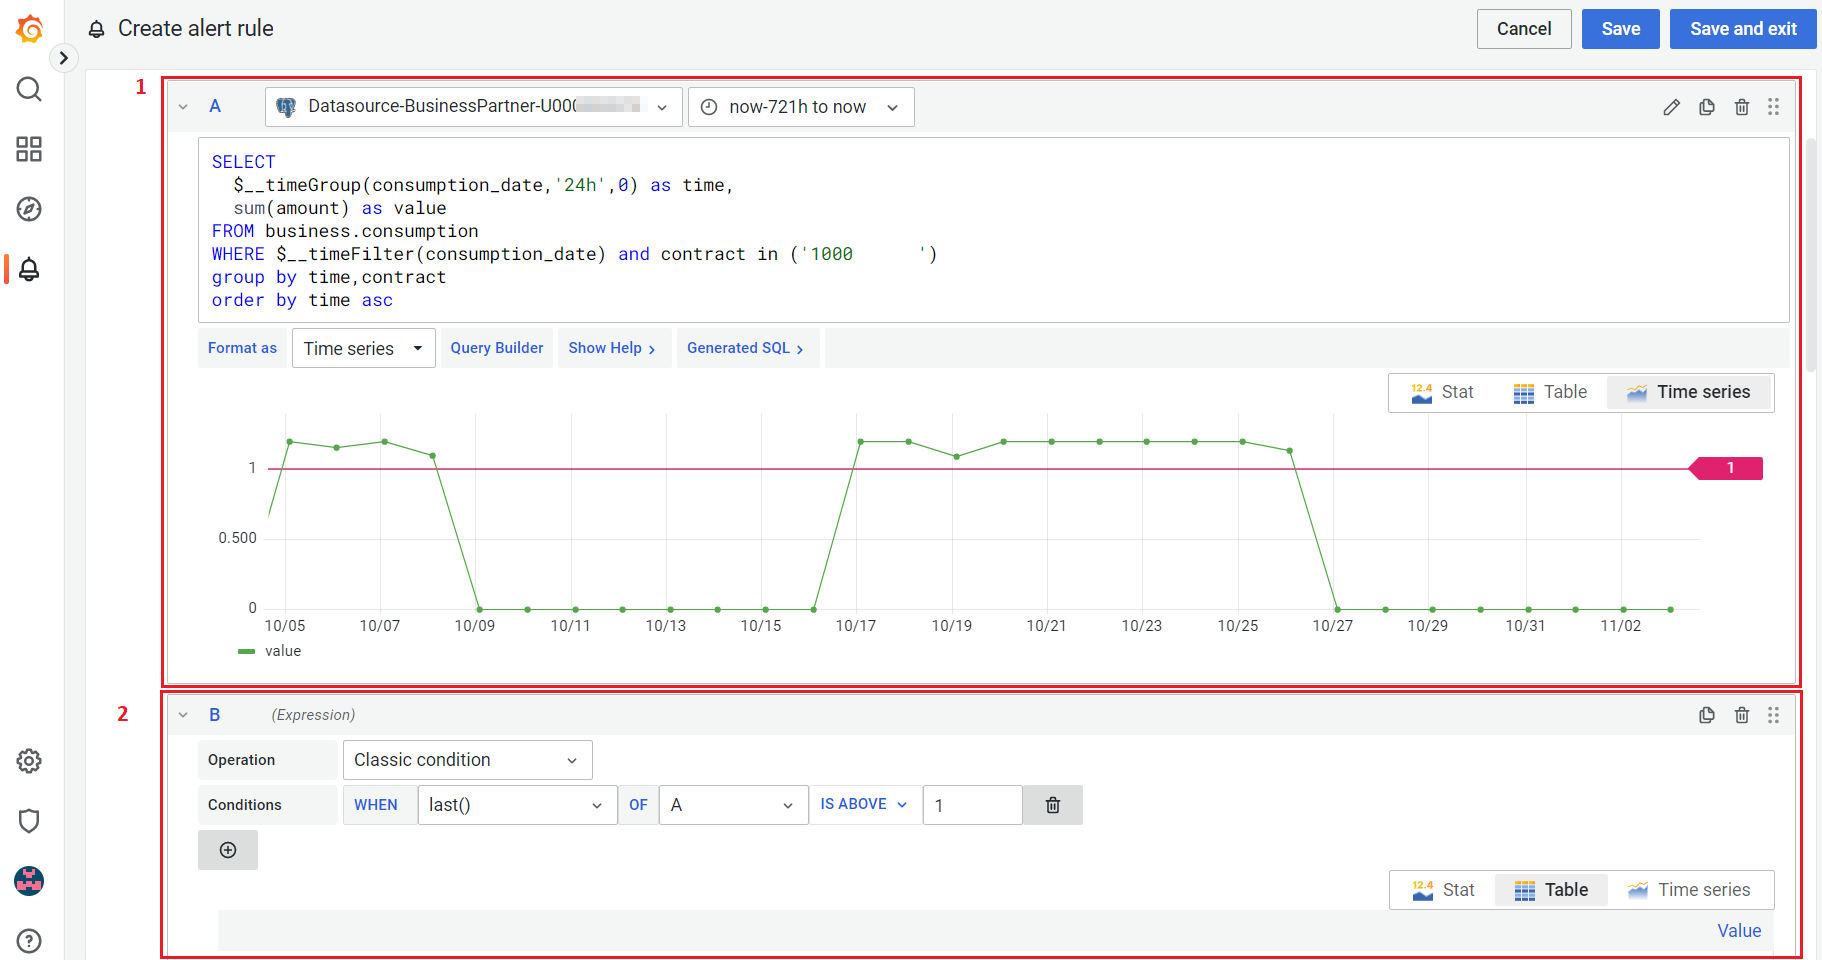
Define conditions for your alert. The following variables are important during the creation of an alert:
Section A or 1 in the above screenshot is the criteria for the monitoring. So create a query that will be used for finding the interested parameter.
Define the relative timeframe you want to monitor. Eg. in above screenshot “query(A,721h,now)” means that the results of query A in the last 30 days are monitored. It’s advised to keep the timeframe short as very long time frame might lead to heavy resource usage query.
Section B or 2 in above screenshot is the abnormal or alert trigger worthy condition. It will shown a red horizontal line in Section A like in above screenshot.
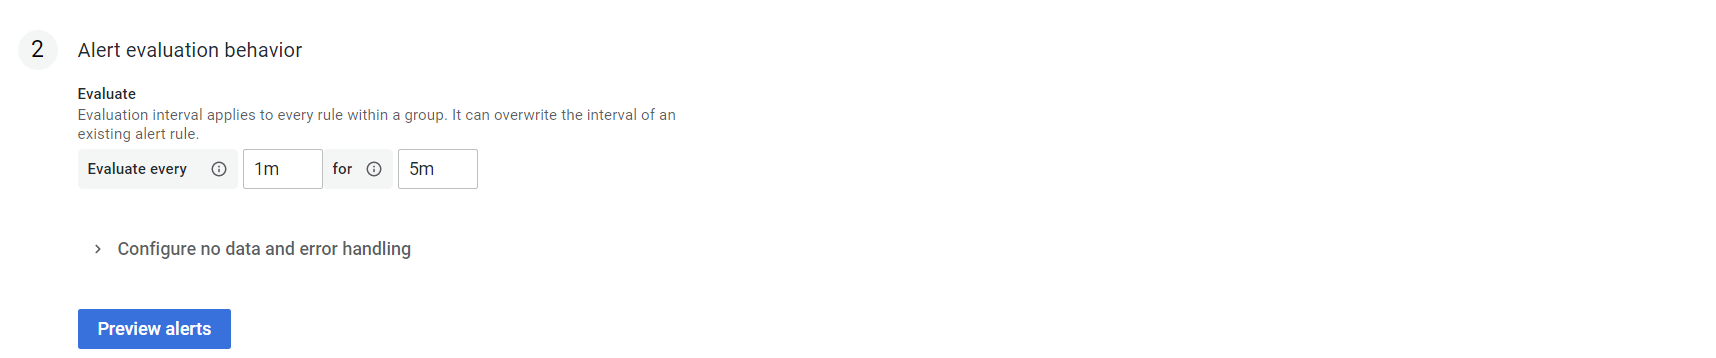
Set the alert condition like in below screenshot if the alert condition exists for more that 5 min alert actions will be executed.
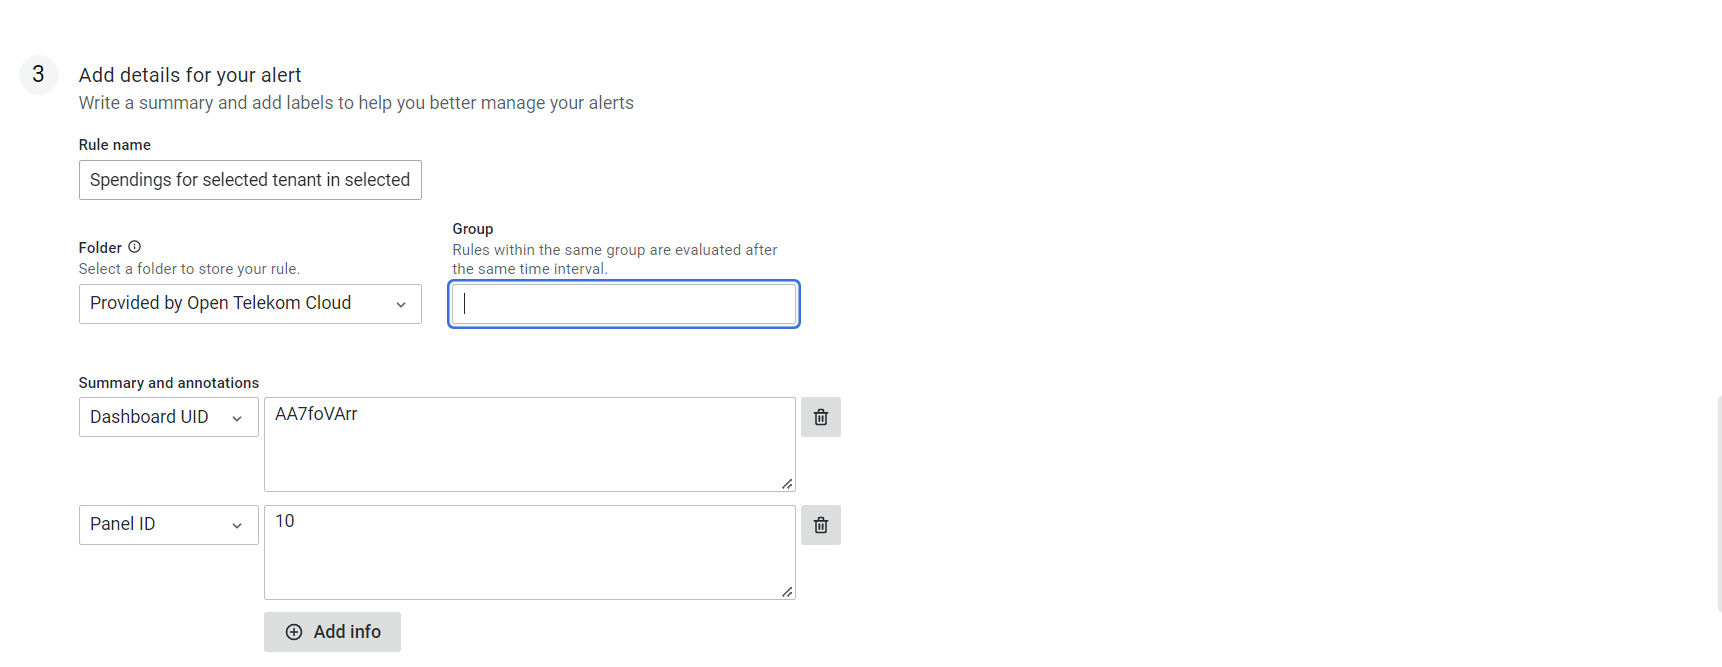
Add the alert details like alert name and group it belongs etc.
Finally set the alert contact or silent conditions to reduce large no alerts.
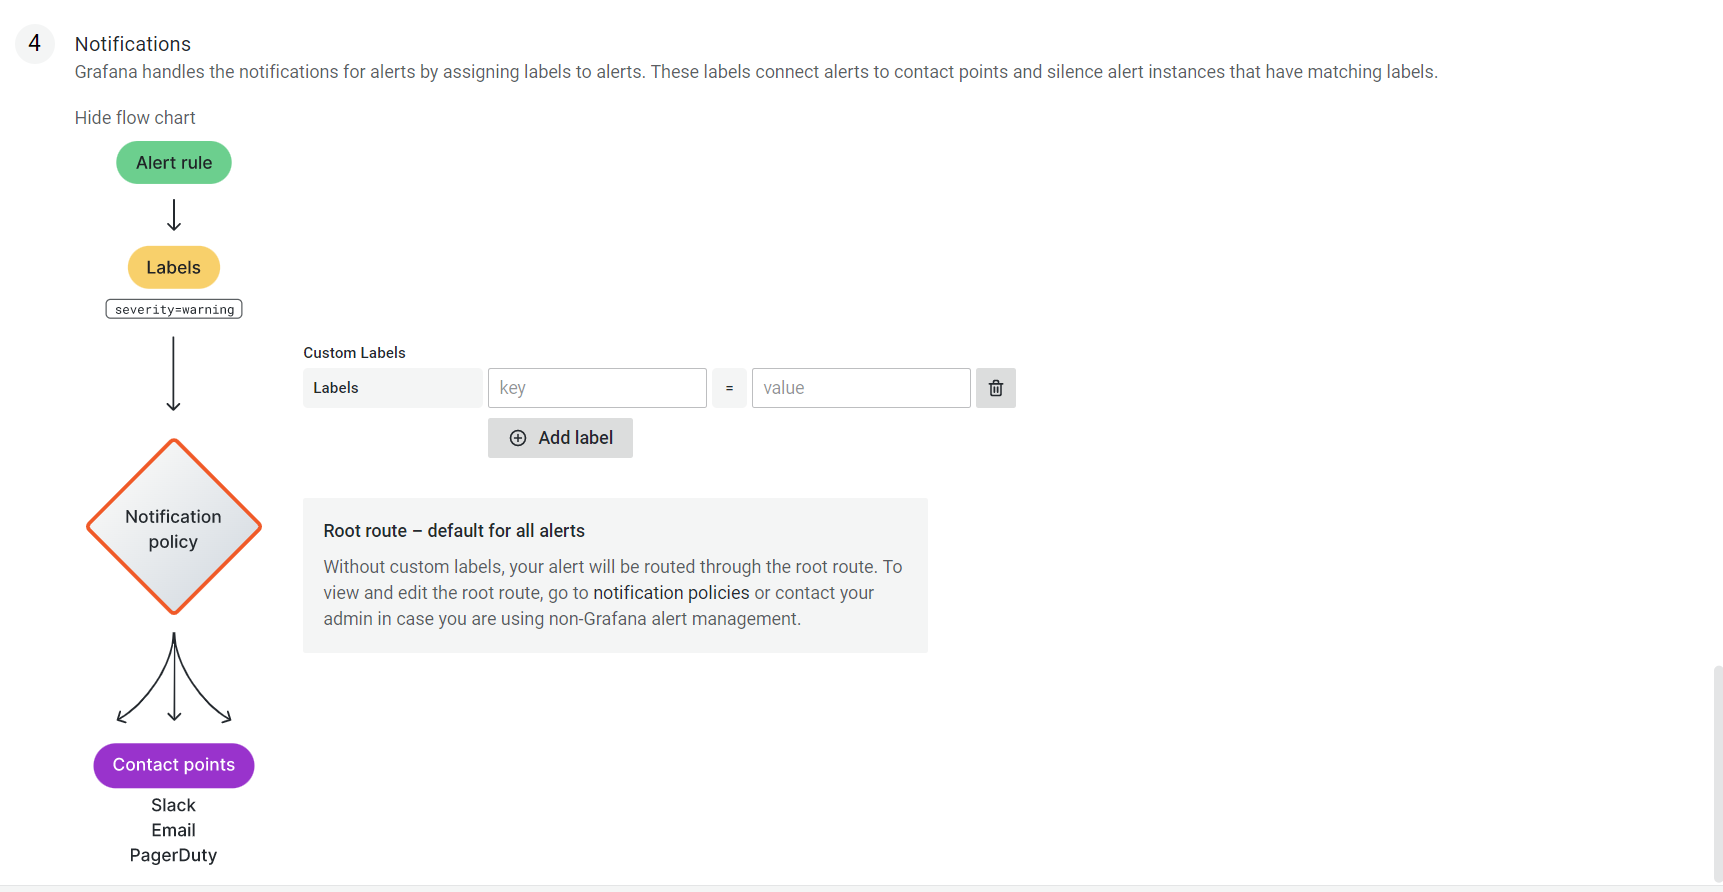
You can create alarms and notification channels as Editor or Admin of an organization. Ask your organization administrator for permission if you want to use this.