FAQ
Question: How can I change the displayed timespan in a dashboard?
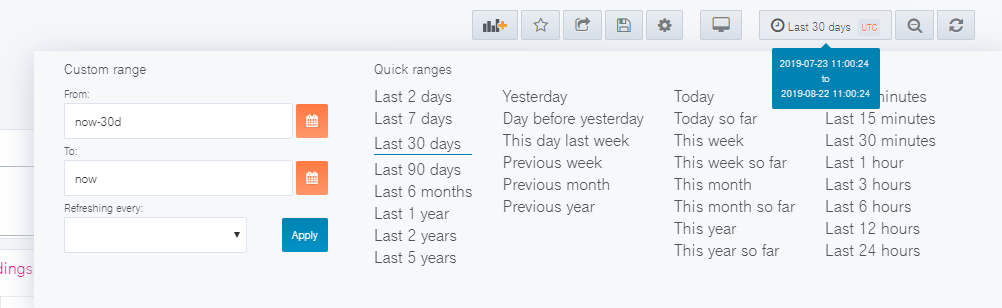
At the top right of each dashboard is a selector where you can configure your displayed timespan. Just click the Clock Icon. See in the screenshot below:
Question: How can I create my own dashboard and widgets?
We recommend creating a new dashboard if you want to have additional widgets. You can check the following documentation to get more information on how to create new widgets.
Getting started: https://grafana.com/docs/guides/getting_started/
New Graphs in dashboards: https://grafana.com/docs/features/panels/graph/
New Tables in dashboards: https://grafana.com/docs/features/panels/table_panel/
Question: My widget is very crowded. How can I select a certain service?
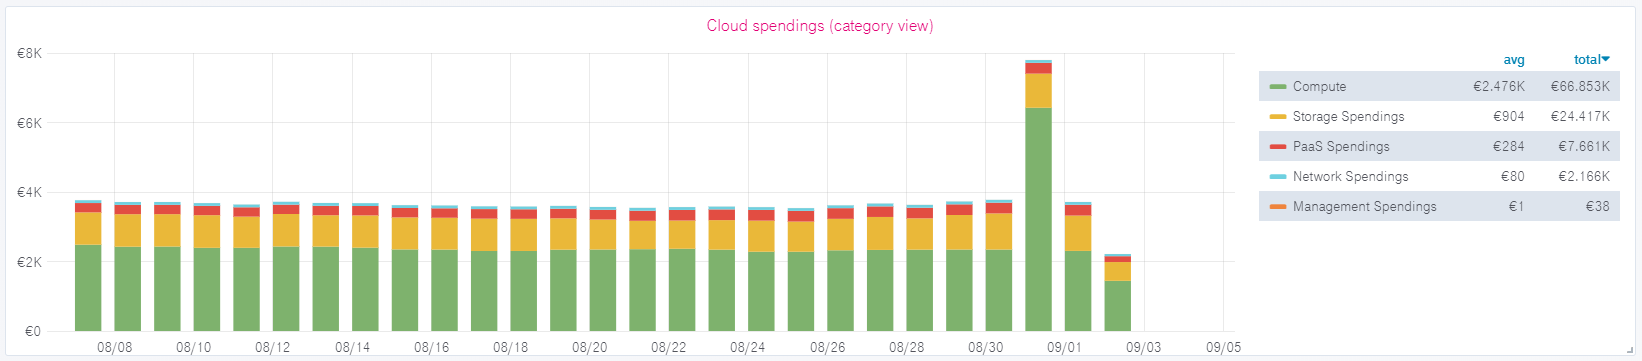
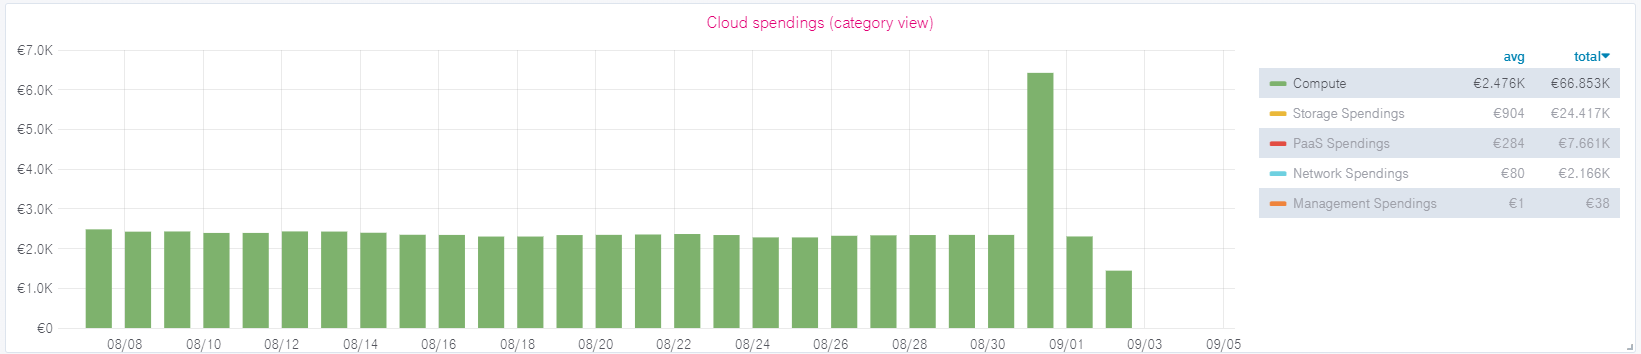
Each widget can be limited to show only one of the originally displayed data sets by clicking the names right next to the graph. You can de-select the data set by clicking it again.
Question: Can I use the Dashboard when data is updated?
Yes, the dashboard will be accessible and data available.
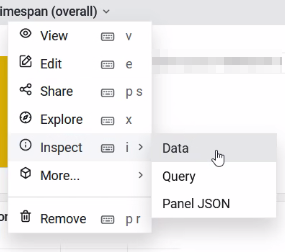
Question: How can I download data?
If you are an Editor or Admin User, it’s possible to download data from each widget by clicking on the name of the widget Inspect Data. You can then download the csv file. Additionally, data can be received via API, please check chapter 4 API
Question: Where do I reset my password?
Please use this link
Additionally, you can reset your password by following the “Forget Password” link on the login page of Enterprise Dashboard.
Question: I can’t log in. What’s wrong?
You can use both email and username to login, but be aware that both the log-in and forget password fields are case-sensitive. This means if your email address is for example configured as Test@provider.com, you also need to log in to Test@provider.com. test@provider.com will not be recognized. If you forgot your password, use the link in chapter 5.6. You can also change your email address to all minor case within the preferences.
Question: I see users who are not added by me in the Grafana User management. Why?
There are four default users which are used by operations or dashboard squad itself to establish hotfixes or to help with customer issues.
Admin
Provisioning
Account for Payer Dashboard
Account for Tenant Dashboard
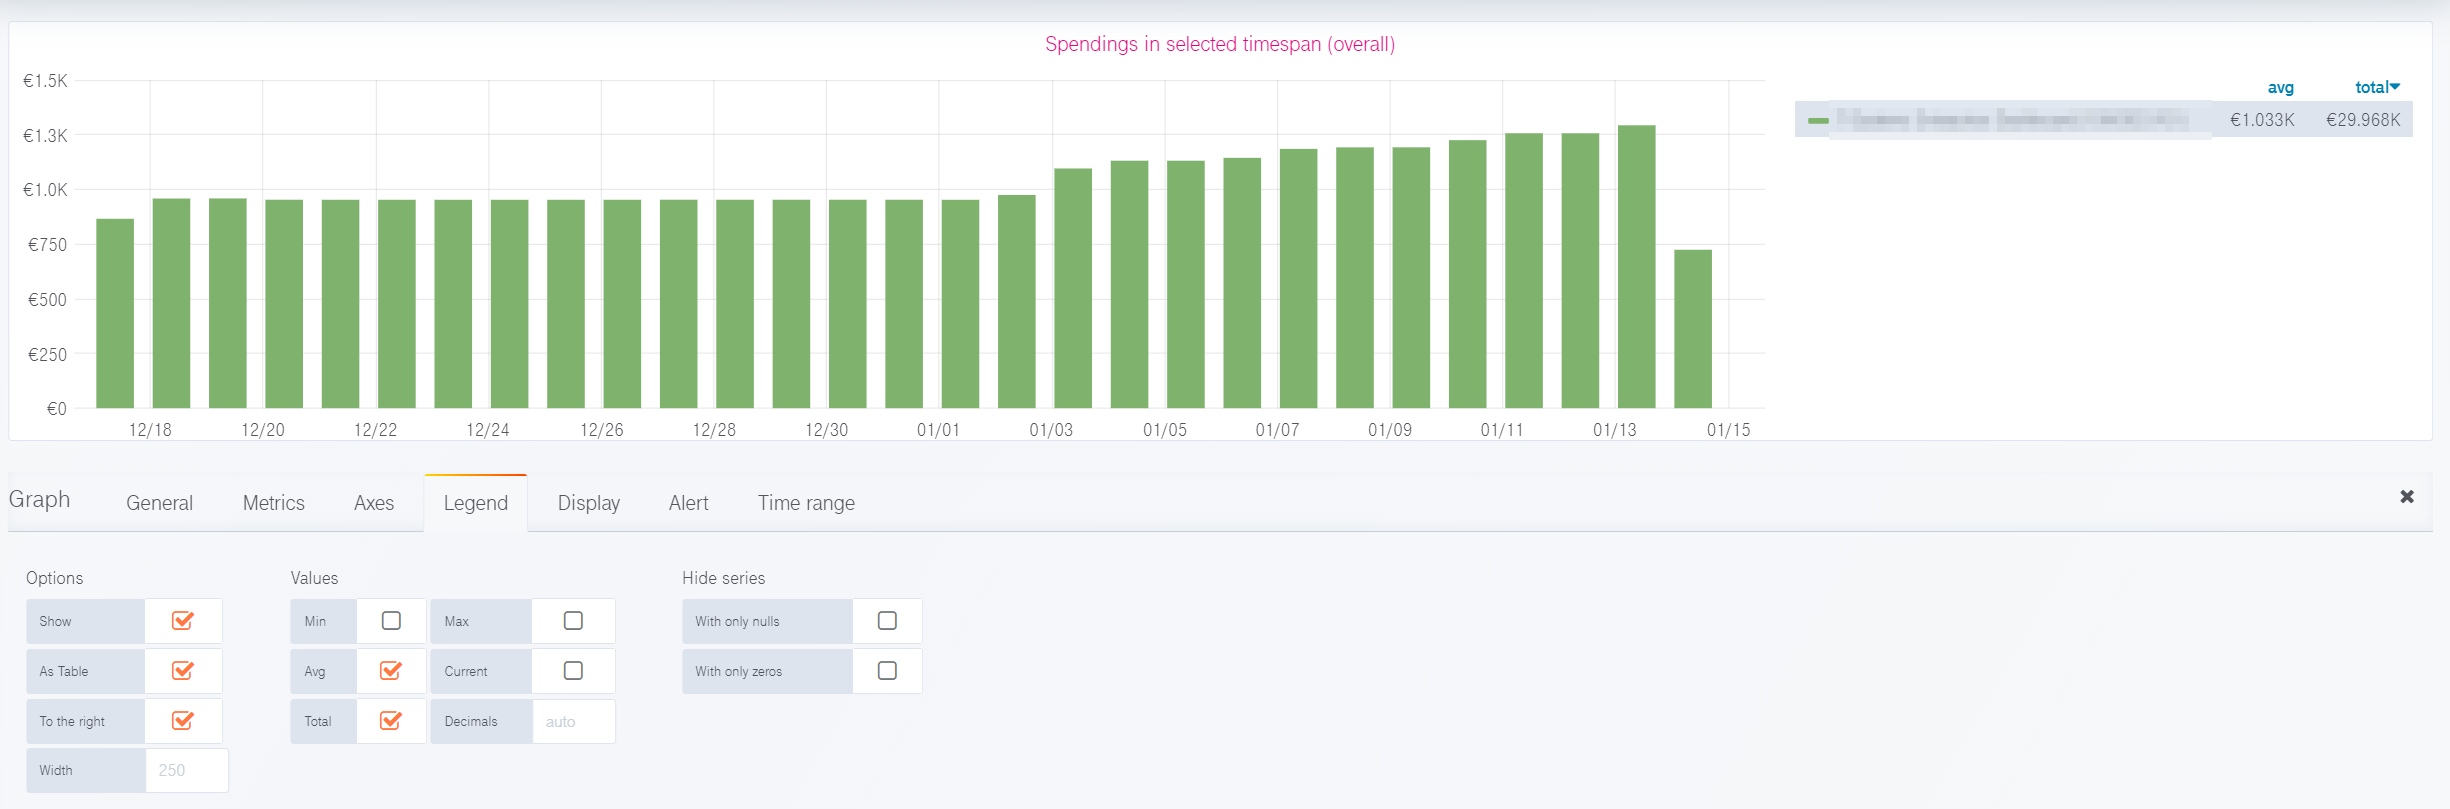
Question: I see “Average” and “Total” in almost every panel. How is this calculated?
The average and total are calculated on the exact amount of datasets in the selected timespan. More information here:
Question: I can see some products with a cost of 0€ and some with 0.00€. What's the difference?
Products that have been used but are still in the free budget will be displayed as 0€. 0.00€ will be displayed if there are costs smaller than 1 cent. Technically those are still costs that will be invoiced, therefore they are displayed in Enterprise Dashboard. You can hide these products by ticking “hide series” options in the legend options of each panel. Please note that editing a dashboard or panel is only available for Editor or Admin Users.
Question: How do you handle daylight savings time changeover?
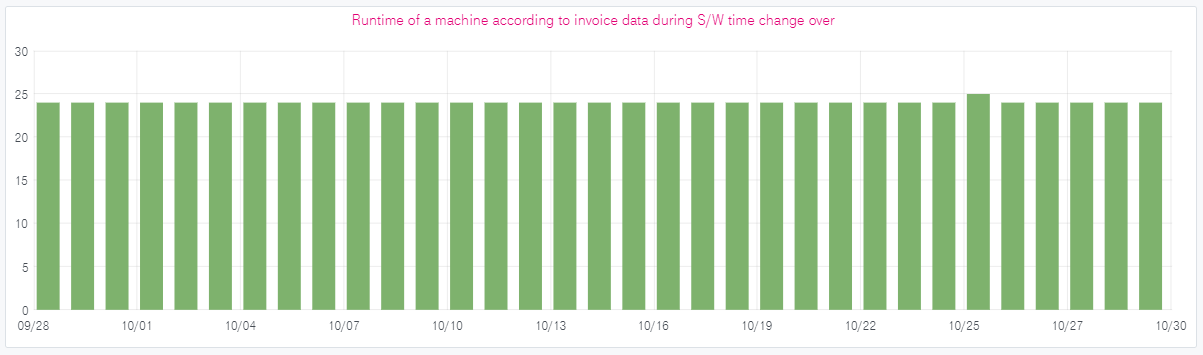
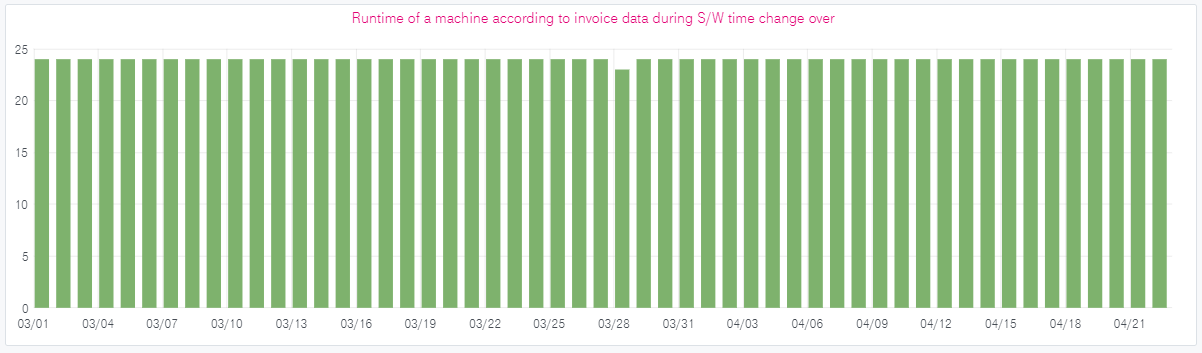
Within Enterprise Dashboard a changeover between summer and winter time is visible on the specific dates by observing the quantity field. For example, a machine that is never stopped will have a runtime of 23 hours on the 28th of March 2021 and 25 hours on the 27th of October 2019.
Below you will find the runtime of a unique machine, which was running 24/7. You can clearly see the drop on a S/W time changeover.
Question: Which version of Enterprise Dashboard do I have?
Enterprise Dashboard will be listed within your invoice, therefore you can see Enterprise Dashboard within your consumption data. Enterprise Dashboard is billed on the first day of a month.
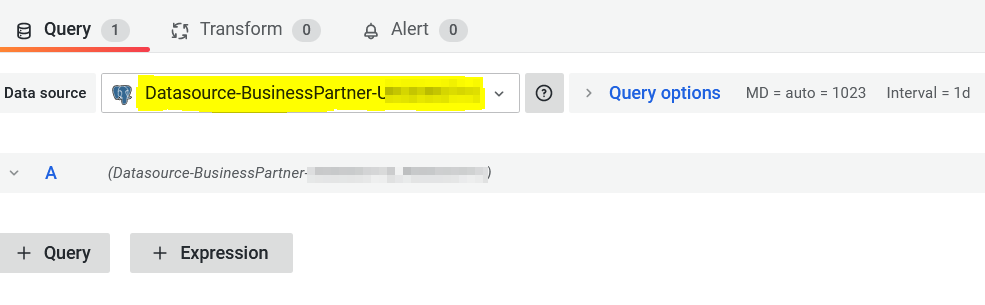
Question: The query editor is not displayed anymore and i can't edit it anymore. How can i solve this?
Unfortunately, this is a known bug in the current Grafana version. To solve this issue, you have to select the datasource with the prefix "Datasource-Contract" or "Datasource-BusinessPartner" as illustrated below.