Viewing the Query Execution Plan and Cost Graphically
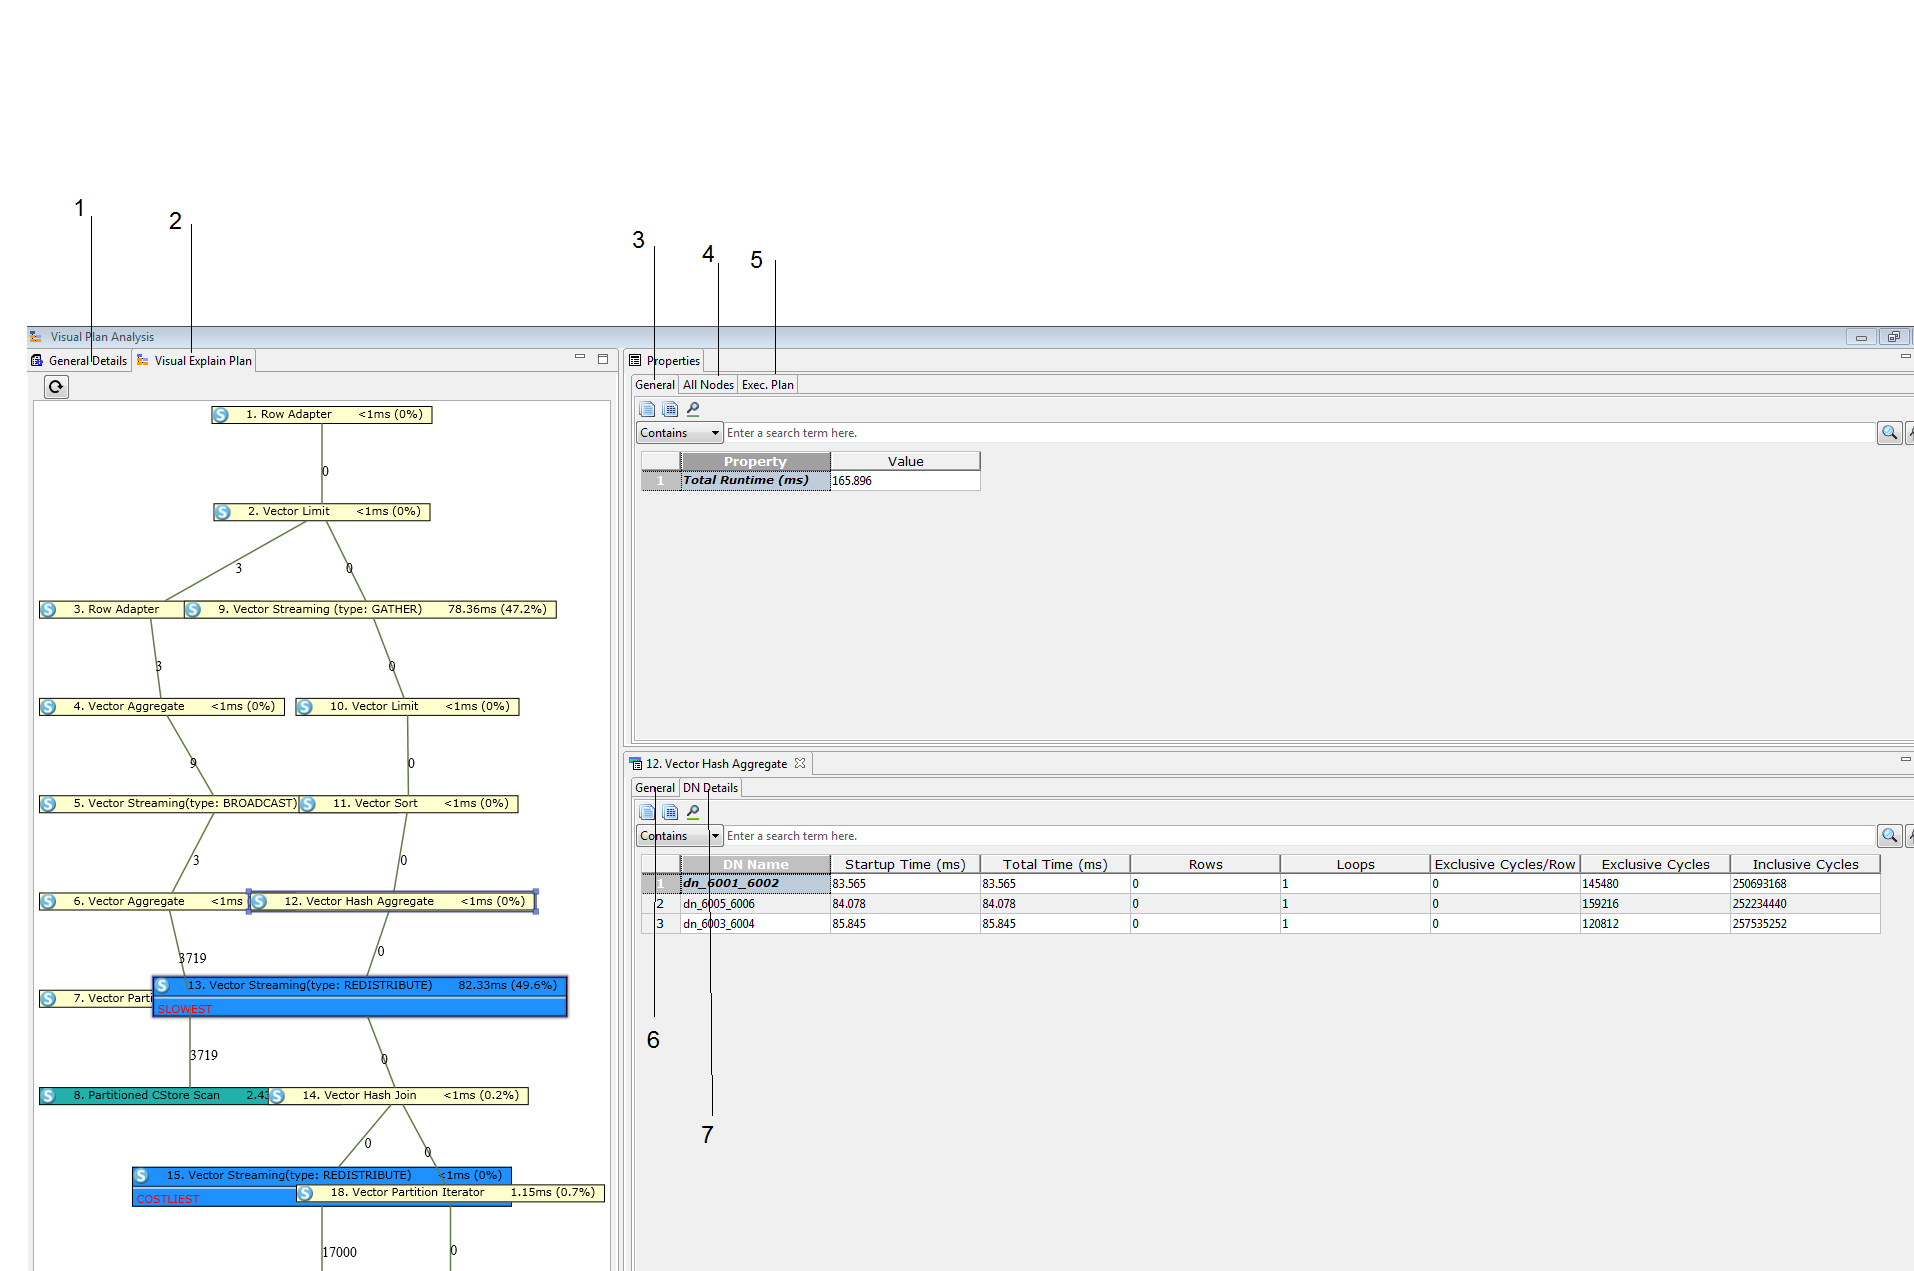
Visual Explain plan displays a graphical representation of the SQL query using information from the extended JSON format. This helps to refine query to enhance query and server performance. It helps to analyze the query path taken by the database and identifies heaviest, costliest and slowest node.
The graphical execution plan shows how the table(s) referenced by the SQL statement will be scanned (plain sequential scan and index scan).
The SQL statement execution cost is the estimate at how long it will take to run the statement (measured in cost units that are arbitrary, but conventionally mean disk page fetches).
Costliest: Highest Self Cost plan node.
Heaviest: Maximum number of rows output by a plan node is considered heaviest node.
Slowest: Highest execution time by a plan node.
Follow the steps to view the graphical representation of plan and cost for a required SQL query:
Enter the query or use an existing query in the SQL Terminal and click
 on the SQL Terminal toolbar. Alternatively, press ALT+CTRL+X together.
Visual Plan Analysis window is displayed.
Refer to Viewing the Query Execution Plan and Cost for information on reconnect option in case connection is lost while retrieving the execution plan and cost.

1 - General Detail tab: This tab displays the query.
2 - Visual Explain Plan tab: This tab displays a graphical representation of all nodes like execution time, costliest, heaviest, and slowest node. Click each node to view the node details.
3 - Properties - General tab: Provides the execution time of the query in ms.
4 - Properties - All Nodes tab: Provides all node information.
Column Name
Description
Node Name
Name of the node
Analysis
Node analysis information
RowsOutput
Number of rows output by the plan node
RowsOutput Deviation (%)
Deviation % between estimated rows output and actual rows output by the plan node
Execution Time (ms)
Execution time taken by the plan node
Contribution (%)
Percentage of the execution time taken by plan node against the overall query execution time.
Self Cost
Total Cost of the plan node - Total Cost of all child nodes
Total Cost
Total cost of the plan node
5 - Properties - Exec. Plan tab - Provides the execution information of all nodes.
Column Name
Description
Node Name
Name of the node
Entity Name
Name of the object
Cost
Execution time taken by the plan node
Rows
Number of rows output by the plan node
Loops
Number of loops of execution performed by each node.
Width
The estimated average width of rows output by the plan node in bytes
Actual Rows
Number of estimated rows output by the plan node
Actual Time
Actual execution time taken by the plan node
6 - Plan Node - General tab - Provides the node information for each node.
Row Name
Description
Output
Provides the column information returned by the plan node
Analysis
Provides analysis of the plan node like costliest, slowest, and heaviest.
RowsOutput Deviation (%)
Deviation % between estimated rows output and actual rows output by the plan node
Row Width (bytes)
The estimated average width of rows output by the plan node in bytes
Plan Output Rows
Number of rows output by the plan node
Actual Output Rows
Number of estimated rows output by the plan node
Actual Startup Time
The actual execution time taken by the plan node to output the first record
Actual Total Time
Actual execution time taken by the plan node
Actual Loops
Number of iterations performed for the node
Startup Cost
The execution time taken by the plan node to output the first record
Total Cost
Execution time taken by the plan node
Is Column Store
This field represents the orientation of the table (column or row store)
Shared Hit Blocks
Number of shared blocks hit in buffer
Shared Read Blocks
Number of shared blocks read from buffer
Shared Dirtied Blocks
Number of shared blocks dirtied in buffer
Shared Written Blocks
Number of shared blocks written in buffer
Local Hit Blocks
Number of local blocks hit in buffer
Local Read Blocks
Number of local blocks read from buffer
Local Dirtied Blocks
Number of local blocks dirtied in buffer
Local Written Blocks
Number of local blocks written in buffer
Temp Read Blocks
Number of temporary blocks read in buffer
Temp Written Blocks
Number of temporary blocks written in buffer
I/O Read Time (ms)
Time taken for making any I/O read operation for the node
I/O Write Time (ms)
Time taken for making any I/O write operation for the node
Node Type
Represents the type of node
Parent Relationship
Represents the relationship with the parent node
Inner Node Name
Child node name
Node/s
No description needed for this field, this will be removed from properties
Based on the plan node type additional information may display. Few examples:
Plan Node
Additional Information
Partitioned CStore Scan
Table Name, Table Alias, Schema Name
Vector Sort
Sort keys
Vector Hash Aggregate
Group By Key
Vector Has Join
Join Type, Hash Condition
Vector Streaming
Distribution key, Spawn On
7 - Plan Node - DN Details tab - Provides detailed data node information for each node. DN Details are available only if data is being collected from data node.
Refer to Viewing Table Data section for description on copy and search toolbar options.