Opening Multiple SQL Terminal Tabs
You can open multiple SQL Terminal tabs in Data Studio to execute multiple SQL statements for query in the current SQL Terminal tab. Perform the following steps to open a new SQL Terminal tab.
You can also open multiple SQL Terminal tabs on different connection templates.
In the Object Browser pane, right-click the desired database and choose Open Terminal from the shortcut menu. Alternatively, click
 in the toolbar or press Ctrl+T to open a new SQL Terminal tab.
The SQL Terminal tab is displayed.
Note
In Data Studio, a maximum of 100 SQL Terminal tabs can be opened for each connected database. Based on the number of query times, each SQL Terminal tab contains multiple Result tabs and one Message tab. If the database connection is lost, the corresponding SQL Terminal tab is still available.
The restoration operation applies to all minimized SQL Terminal tabs. You cannot restore a single tab.
After all terminals are shut down, Data Studio resets the counter of the SQL terminal.
After all Result Set tabs are closed, Data Studio resets the counter of the result set.
Data Studio allows you to reset counters in the following pages: Display DDL Tablespace, Display DDL User/Role, Batch Delete, Result Set, and Execution Plan.
Data Studio displays an error message indicating that no result is found in the status bar. The Result tab displays the successful execution results.
Perform the following steps to open a new SQL Terminal tab in another connection:
Select the required connection from the connection list in the toolbar.
In the Object Browser pane, right-click the desired connected database and choose Open Terminal, or click
 in the toolbar. The SQL Terminal tab is displayed.
The name format of the new SQL Terminal tab is as follows:
Database name@Connection information(Tab number), for example, postgres@IDG_1(2). The number of each SQL Terminal tab in the same connection information is unique.
Result Tab (Text View)
You can view data in text mode in the Result tab.
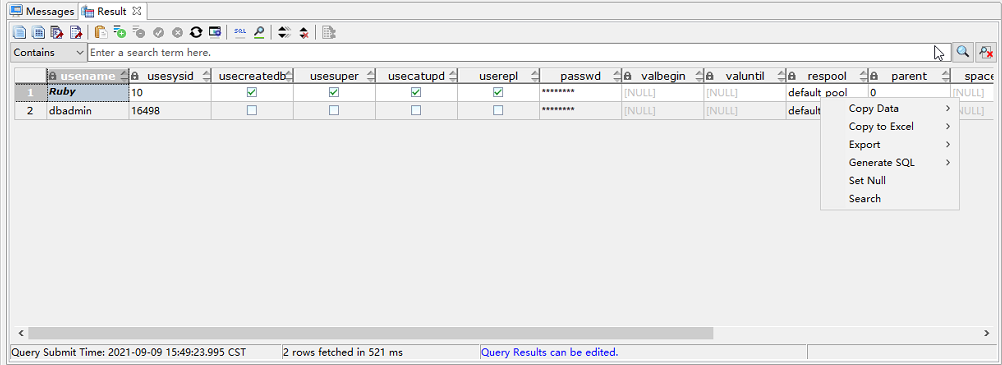
In addition to the grid view, you can also copy and search for data in the text view.
Click  to obtain the result in text mode.
Note
Searching for data in multiple cells may cause the system to display incorrect text results, because all information needs to be copied to the Search pane in plain text.
Displaying Execution Progress Bar
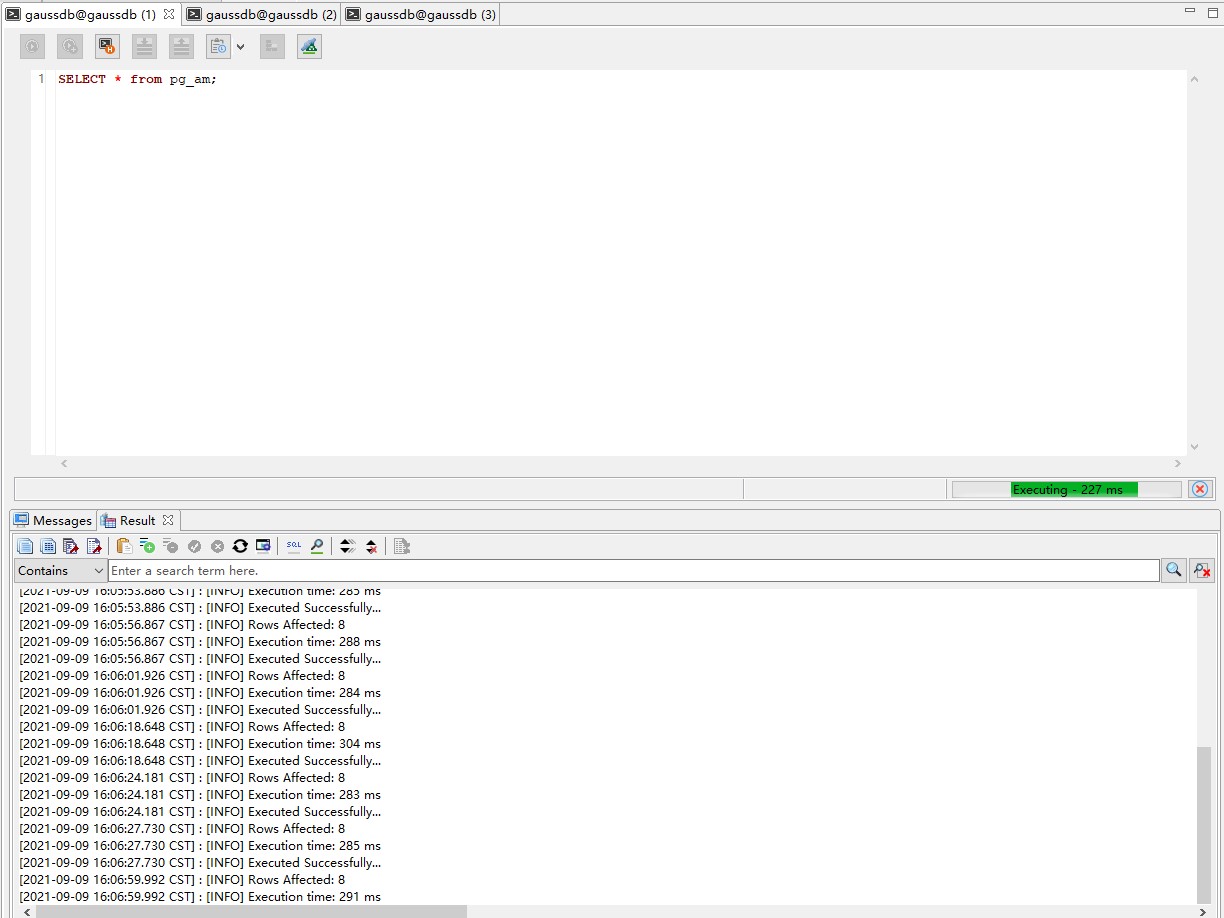
When a query is executed in the SQL Terminal pane, a progress bar is displayed to dynamically display the execution duration. After the query is complete, the time bar disappears. The total execution duration is displayed next to the time bar.
If you want to cancel the query, click Cancel next to the time bar.
The procedure is shown in the following figure.

Note
The Cancel button is deleted from the toolbar.
The progress bar is also displayed when you compile or debug an object in the PL/SQL editor.
The time format displayed in the progress bar is w hour x minute y second z millisecond.
When queries are performed in batches in SQL Terminal, the progress bar displays the total time consumed by the queries.
Debugging Duration
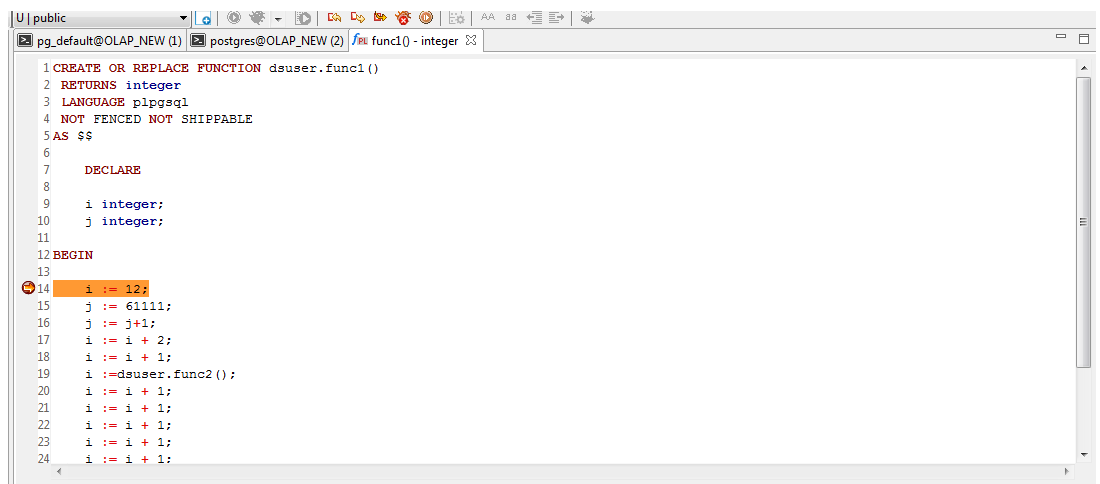
During debugging, Data Studio displays the status bar, showing the last operation time and total debugging time of each debugging statement.
During the debugging, the last operation time and total debugging time of the terminal are updated continuously. The value of the total debugging time is the sum of the values of the last operation time.
This simplifies the search for time-consuming statements in the debugged object.
The procedure is shown in the following figure.

Note
Functions and procedures can be debugged.
Debugging applies only to OLAP.
