Viewing Stream Monitoring Metrics
You can view stream monitoring information on the console and monitor the data consumed by applications in the stream.
Use the account to log in to the DIS console.
Click
 in the upper left corner and select a region and a project.
In the navigation tree on the left, choose Stream Management.
In the stream list, click the name of the DIS stream whose monitoring metrics you want to view.
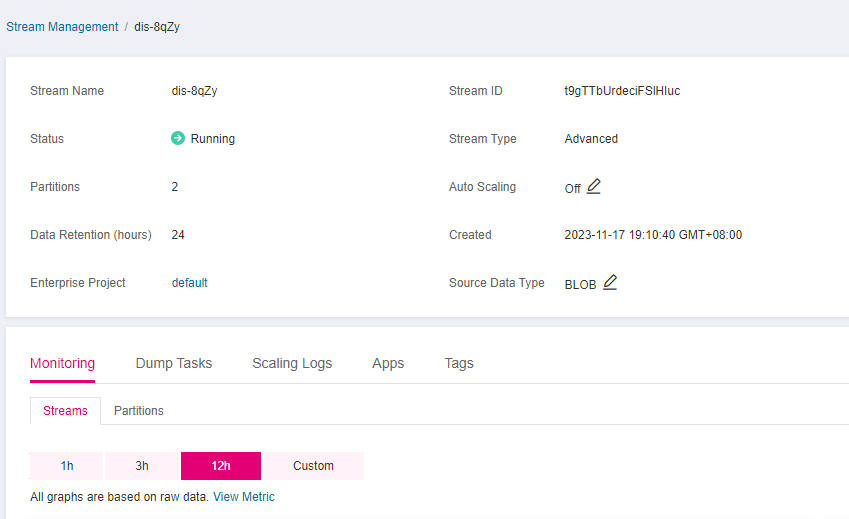
Figure 1 Monitoring page
On the Monitoring page, click the Streams or Partitions tab to view stream or partition monitoring metrics. Table 1 describes the monitoring parameters. For details about basic stream information, see Table 1.
Table 1 DIS monitoring information¶ Parameter
Description
Time Range
Monitoring time range.
Values:
1h
3h
12h
You can customize the time range for viewing monitoring information.
Click
 next to Custom, and then set the start time and end time.
The end time cannot be later than the current system time.
The difference between the start time and end time cannot exceed 72 hours.
Partitions
Partition ID
ID of the partition. It starts from 0 by default. Select any of the following values from the Partition ID drop-down.
Data Rate (KB/s)
Rates at which data is sent to and retrieved from the chosen partition within the specified time range. Unit: KB/s
Records Per Second
The number of records sent to and retrieved from the chosen partition within the specified time range.
Streams
Data Rate (KB/s)
Rates at which data is sent to and retrieved from the chosen DIS stream within the specified time range. Unit: KB/s
Records Per Second
The number of records sent to and retrieved from the chosen DIS stream within the specified time range.
Successful Requests Per Second
The number of PutRecords and GetRecords requests successfully fulfilled within the specified time range.
Throttled Requests Per Second
The number of PutRecords and GetRecords requests rejected within the specified time range due to flow control.
Average Request Processing Time (ms)
The average amount of time spent in processing a PutRecords or GetRecords request.