Querying Metrics of a Cloud Service
Cloud Eye provides multiple built-in metrics based on the characteristics of each service. After you enable one cloud service on the cloud platform, Cloud Eye automatically associates its built-in metrics. You can track the cloud service status by monitoring these metrics.
This topic describes how to view monitoring data of a cloud service resource.
Procedure
Log in to the management console.
In the upper left corner, select a region and project.
Click Service List in the upper left corner and select Cloud Eye.
In the navigation pane on the left, choose Cloud Service Monitoring and select a cloud service.
The cloud service page is displayed.
Locate the row containing the cloud service resource you want to monitor and click View Metric in the Operation column.
The detailed monitoring page is displayed.
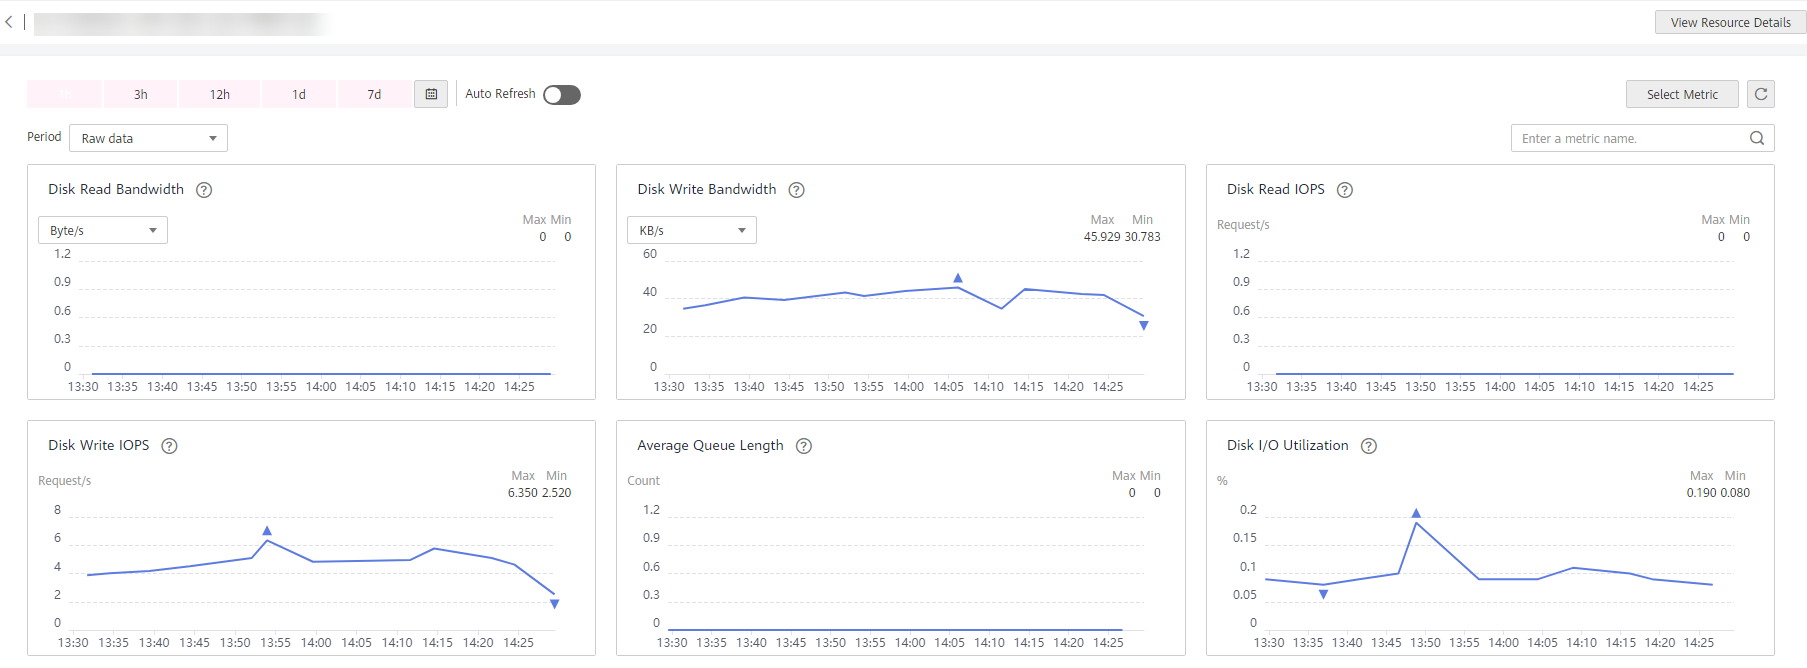
You can view graphs based on raw data collected in the last 1h, 3h, 12h, 1d, and 7d. You can also customize the time range. In the upper right corner of the graph, the maximum and minimum values of the metric in the corresponding time periods are dynamically displayed. You can also enable Auto Refresh to view the real-time data refreshed every minute.

Figure 1 Viewing graphs
Note
Units of some metrics can be changed between byte or byte/s and GB or GB/s on graphs. When you are changing the unit, if the maximum value of a metric is smaller than 10^ (-5), both the maximum value and the minimum value of this metric are 0. In addition, all data displayed on the graph is 0.
If Auto Refresh is enabled, data is automatically refreshed every minute.
You can search for a specific metric in the search box.
Some cloud services allow you to view resource details. You can click View Resource Details in the upper part of the page to view details about monitored resources.
Near the top right corner of the page, click Select Metric.
The Select Metric dialog box is displayed.
Select at least one metric. Drag and drop the selected metrics at desired locations to sort them. This helps you customize metrics to be viewed.
Hover your mouse over a graph and click
 in the upper right corner.
An enlarged graph of the metric is displayed, on which you can view the metric monitoring details for longer time ranges. In the upper left corner, you can see six default monitoring periods: 1h, 3h, 12h, 1d, 7d, and 30d. You can also view historical monitoring data for any period during the last six months by customizing the monitoring period in the upper right corner of the graph.
Note
If you select 1h, 3h, 12h, or 1d, raw data is displayed by default. You can set Period and Statistic to change the aggregation period of the monitoring data. For details about the aggregation period, see What Is Aggregation?
If you select 7d or 30d, aggregated data is displayed by default. You can set Period and Statistic to change the aggregation period of monitoring data.
In the upper right corner of the monitoring view, click
 to create an alarm rule for a metric.
Note
This icon is not available in the enlarged graph mode.
To export data, click Export Data on the Cloud Service Monitoring page, configure parameters, and click Export. For details, see How Can I Export Collected Data?