Access Logging
Scenarios
ELB logs HTTP and HTTPS requests received by load balancers, including the time when the request was sent, client IP address, request path, and server response.
With Log Tank Service (LTS), you can view logs of requests to load balancers at Layer 7 and analyze response status codes to quickly locate unhealthy backend servers.
Note
ELB displays operations data, such as access logs, on the LTS console. Do not transmit private or sensitive data through fields in access logs. Encrypt your sensitive data if necessary.
Constraints
Access logging can be configured only for load balancers that have HTTP or HTTPS listeners.
The access logs do not contain requests whose return code is 400 Bad Request. This is because such requests do not comply with HTTP specification and cannot be processed properly.
Prerequisites
You have created a load balancer that can work at Layer 7. For details, see Creating a Dedicated Load Balancer.
You have enabled LTS.
You have created a backend server group, added backend servers to the group, and deployed services on the backend servers. For details, see Creating a Backend Server Group (Dedicated Load Balancers).
You have added an HTTP or HTTPS listener to the load balancer. For details, see Adding an HTTP Listener or Adding an HTTPS Listener.
Flowchart

Figure 1 Process for locating an unhealthy backend server
Creating a Log Group
Log in to the management console.
In the upper left corner of the page, click
 and select the desired region and project.
In the upper left corner of the page, click
 and select Log Tank Service under Management & Deployment.
In the navigation pane on the left, choose Log Management.
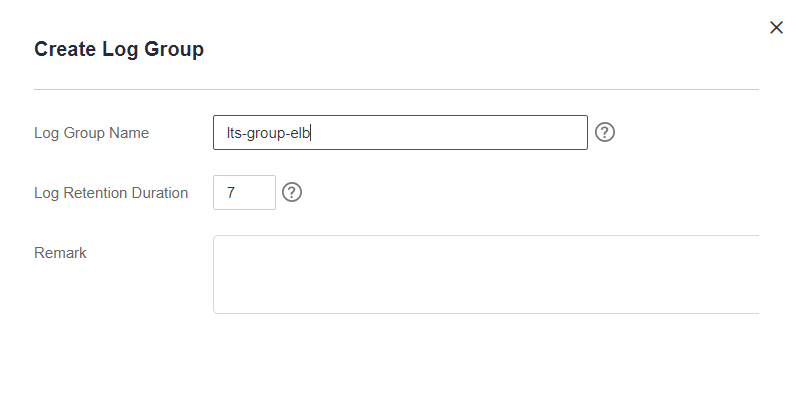
Click Create Log Group. In the displayed dialog box, enter a name for the log group.

Figure 2 Creating a log group
Click OK.
Creating a Log Stream
On the LTS console, click
 on the left of the target log group.
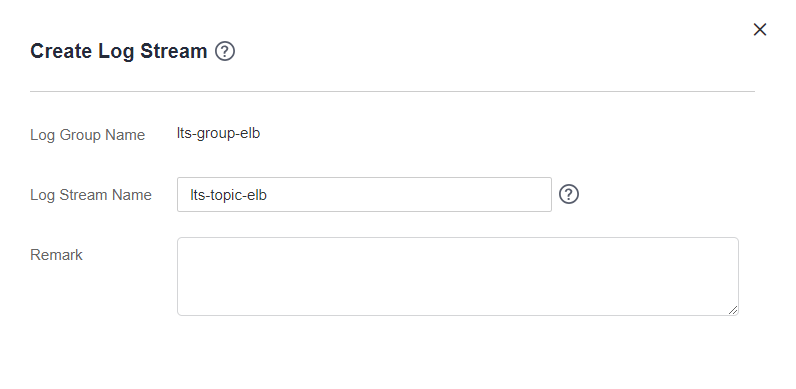
Click Create Log Stream. In the displayed dialog box, enter a name for the log stream.

Figure 3 Creating a log stream
Click OK.
Configuring Access Logging
Click
 in the upper left corner to display Service List and choose Network > Elastic Load Balancing.
Locate the load balancer and click its name.
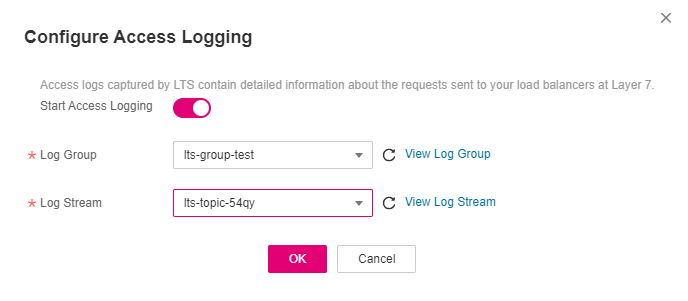
Under Access Logs, click Configure Access Log.
Enable access logging and select the log group and log stream you created.

Figure 4 Configuring access logging
Click OK.
Important
Ensure that the log group is in the same region as the load balancer.
Viewing Access Logs
You can view details about access logs on the:
ELB console: Click the name of the load balancer and click Access Logs to view logs.
(Recommended) LTS console: Locate the target log group and click its name. On the displayed page, locate the target log stream and click Real-Time Logs tab.
The log format is as follows, which cannot be modified:
$msec $access_log_topic_id [$time_iso8601] $log_ver $remote_addr:$remote_port $status "$request_method $scheme://$host$router_request_uri $server_protocol" $request_length $bytes_sent $body_bytes_sent $request_time "$upstream_status" "$upstream_connect_time" "$upstream_header_time" "$upstream_response_time" "$upstream_addr" "$http_user_agent" "$http_referer" "$http_x_forwarded_for" $lb_name $listener_name $listener_id
$pool_name "$member_name" $tenant_id $eip_address:$eip_port "$upstream_addr_priv" $certificate_id $ssl_protocol $ssl_cipher $sni_domain_name $tcpinfo_rtt $self_defined_header $request_header_length $actions_executed $error_reason "$pool_usr_name"
The following is a log example:
1644819836.370 eb11c5a9-93a7-4c48-80fc-03f61f638595 [2024-02-14T14:23:56+02:00] elb_01 192.168.1.1:888 200 "POST https://www.test.com/example/ HTTP/1.1" 1411 251 3 0.011 "200" "0.000" "0.011" "0.011" "192.168.1.2:8080" "okhttp/3.13.1" "-" "-" loadbalancer_295a7eee-9999-46ed-9fad-32a62ff0a687 listener_20679192-8888-4e62-a814-a2f870f62148 3333fd44fe3b42cbaa1dc2c641994d90 pool_89547549-6666-446e-9dbc-e3a551034c46 "-" f2bc165ad9b4483a9b17762da851bbbb 121.64.212.1:443 "10.1.1.2:8080" - TLSv1.2 ECDHE-RSA-AES256-GCM-SHA384 www.test.com 56704 -
Table 1 describes the fields in the log.
Parameter | Description | Value Description | Example Value |
|---|---|---|---|
msec | Time when the log is written, in seconds with a milliseconds resolution. | Floating-point data | 1644819836.370 |
access_log_topic_id | Log stream ID. | uuid | eb11c5a9-93a7-4c48-80fc-03f61f638595 |
time_iso8601 | Local time in the ISO 8601 standard format. | N/A | [2024-02-14T14:23:56+02:00] |
log_ver | Log format version. | Fixed value: elb_01 | elb_01 |
remote_addr: remote_port | IP address and port number of the client. | Records the IP address and port of the client. | 192.168.1.1:888 |
status | HTTP status code. | Records the request status code. | 200 |
request_method scheme://host request_uri server_protocol | Request method Protocol://Host name: Request URI Request protocol |
| "POST https://www.test.com/example/ HTTP/1.1" |
request_length | Length of the request received from the client, including the header and body. | Integer | 1411 |
bytes_sent | Number of bytes sent to the client. | Integer | 251 |
body_bytes_sent | Number of bytes sent to the client (excluding the response header). | Integer | 3 |
request_time | Request processing time in seconds from the time when the load balancer receives the first request packet from the client to the time when the load balancer sends the response packet. | Floating-point data | 0.011 |
upstream_status | Response status code returned by the backend server.
| HTTP status code returned by the backend server to the load balancer | "200" |
upstream_connect_time | Time taken to establish a connection with the server, in seconds, with a milliseconds resolution.
| Floating-point data | "0.000" |
upstream_header_time | Time taken to receive the response header from the server, in seconds, with a milliseconds resolution.
| Floating-point data | "0.011" |
upstream_response_time | Time taken to receive the response from the server, in seconds, with a milliseconds resolution.
| Floating-point data | "0.011" |
upstream_addr | IP address and port number of the backend server. There may be multiple values separated by commas and spaces, and each value is in the format of {IP address}:{Port number} or -. | IP address and port number | "192.168.1.2:8080" |
http_user_agent | http_user_agent in the request header received by the load balancer, indicating the system model and browser information of the client. | Records the browser-related information. | "okhttp/3.13.1" |
http_referer | http_referer in the request header received by the load balancer, indicating the page link of the request. | Request for a page link | "-" |
http_x_forwarded_for | http_x_forwarded_for in the request header received by the load balancer, indicating the IP address of the proxy server that the request passes through. | IP address | "-" |
lb_name | Load balancer name in the format of loadbalancer_load balancer ID | String | loadbalancer_295a7eee-9999-46ed-9fad-32a62ff0a687 |
listener_name | Listener name in the format of listener_listener ID. | String | listener_20679192-8888-4e62-a814-a2f870f62148 |
listener_id | ID of the listener added to the load balancer. | String | 3333fd44fe3b42cbaa1dc2c641994d90 |
pool_name | Backend server group name in the format of pool_backend server group ID or pool_backend server group ID*load balancer ID. | String | pool_89547549-6666-446e-9dbc-e3a551034c46 |
member_name | Backend server name in the format of member_server ID. This field is not supported yet. There may be multiple values separated by commas and spaces, and each value is a member ID (member_id) or -. | String | "-" |
tenant_id | Tenant ID. | String | f2bc165ad9b4483a9b17762da851bbbb |
eip_address:eip_port | EIP of the load balancer and frontend port that were set when the listener was added. | EIP of the load balancer and frontend port that were set when the listener was added. | 121.64.212.1:443 |
upstream_addr_priv | IP address and port number of the backend server. There may be multiple values separated by commas and spaces, and each value is in the format of {IP address}:{Port number} or -. | IP address and port number | "-" (Dedicated load balancers) |
certificate_id | HTTPS listener: Certificate ID used for establishing an SSL connection. This field is not supported yet. | String | N/A |
ssl_protocol | HTTPS listener: Protocol used for establishing an SSL connection. For a non-HTTPS listener, a hyphen (-) is displayed as a null value for this field. | String | TLSv1.2 |
ssl_cipher | HTTPS listener: Cipher suite used for establishing an SSL connection. For a non-HTTPS listener, a hyphen (-) is displayed as a null value for this field. | String | ECDHE-RSA-AES256-GCM-SHA384 |
sni_domain_name | HTTPS listener: SNI domain name provided by the client during SSL handshakes. For a non-HTTPS listener, a hyphen (-) is displayed as a null value for this field. | String | www.test.com |
tcpinfo_rtt | TCP Round Trip Time (RTT) between the load balancer and client in microseconds. | Integer | 56704 |
self_defined_header | This field is reserved. The default value is -. | String | "-" |
request_header_length | The size of the header in the client request. | Integer | 129 |
actions_executed | The WAF execution result. | String
| waf |
error_reason | Reason why requesting WAF fails. | String
| N/A |
Log analysis
At 14:23:56 GMT+02:00 on Feb 14, 2024, the load balancer receives an HTTP/1.1 POST request from a client whose IP address and port number are 192.168.1.1 and 888, then routes the request to a backend server whose IP address and port number are 100.64.0.129 and 8080, and finally returns 200 OK to the client after receiving the status code from the backend server.
Analysis results
The backend server responds to the request normally.
Locating an Unhealthy Backend Server
The following is a log that records an exception:
1554944564.344 - [2024-04-11T09:02:44+02:00] elb 10.133.251.171:51527 500 "GET http://10.154.73.58/lrange/guestbook HTTP/1.1" 411 3726 3545 19.028 "500" "0.009" "19.028" "19.028" "172.17.0.82:3000" "Mozilla/5.0 (Windows NT 6.1; Win64; x64) AppleWebKit/537.36 (KHTML, like Gecko) Chrome/73.0.3683.103 Safari/537.36" "http://10.154.73.58:5971/" "-" loadbalancer_ed0f790b-e194-4657-9f97-53426227099e listener_b21dd0a9-690a-4945-950e-b134095c6bd9 6b6aaf84d72b40fcb2d2b9b28f6a0b83
Log analysis
At 09:02:44 GMT+02:00 of April 11, 2024, the load balancer received a GET/HTTP/1.1 request from the client whose IP address and port number are 10.133.251.171 and 51527 respectively and then routed the request to a backend server that uses 172.17.0.82 and port 3000 to receive requests. The load balancer then received 500 Internal Server Error from the backend server and returned the status code to the client.
Analysis results
The backend server was unhealthy and failed to respond to the request.
Note
172.17.0.82:3000 is the private IP address of the backend server.