Viewing Redis Slow Queries
Redis logs queries that exceed a specified execution time. You can view the slow query log on the DCS console to identify performance issues.
For details about the commands, visit the Redis official website.
Configure the slow log with the following parameters:
slowlog-log-slower-than: The maximum time allowed, in microseconds, for command execution. If this threshold is exceeded, Redis will log the command. The default value is 10,000. That is, if command execution exceeds 10 ms, the command will be logged.
slowlog-max-len: The maximum allowed number of slow queries that can be logged. The default value is 128. That is, if the number of slow queries exceeds 128, the earliest record will be deleted to make room for new ones.
For details about the configuration parameters, see Modifying Configuration Parameters.
Note
You can view the slow log of a Proxy Cluster DCS Redis 3.0 instance only if the instance is created after October 14, 2019. If the instance was created earlier, contact technical support to upgrade it. The upgrade adds the slow log function to the console, and does not affect services.
Viewing Slow Queries on the Console
Log in to the DCS console.
Click
 in the upper left corner and select a region and a project.
In the navigation pane, choose Cache Manager.
Click the name of a DCS instance.
Choose Analysis and Diagnosis > Slow Queries.
Select a start date and an end date and click the refresh icon to view slow queries within the specified period.
Note
For details about the commands, visit the Redis official website.
Slow queries of up to seven days can be queried.
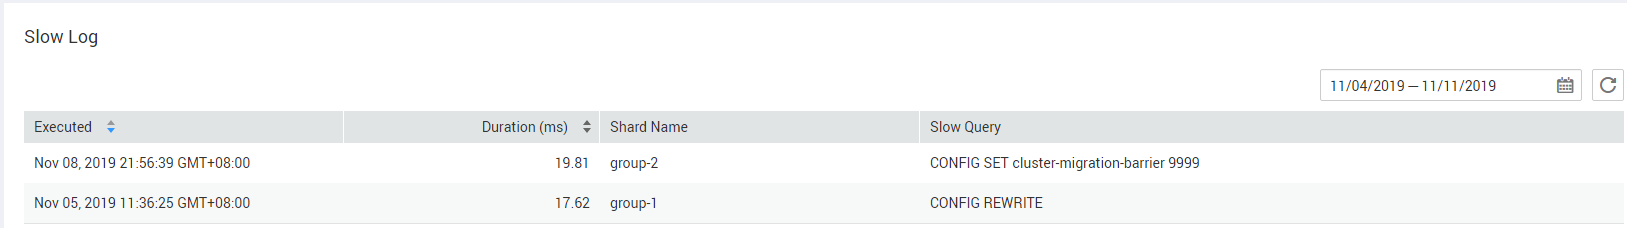
Figure 1 Slow query log of an instance