Viewing Event Monitoring Data
Scenarios
This topic describes how to view the event monitoring data.
Procedure
Log in to the management console.
Click Service List in the upper left corner and select Cloud Eye.
In the navigation pane on the left, choose Event Monitoring.
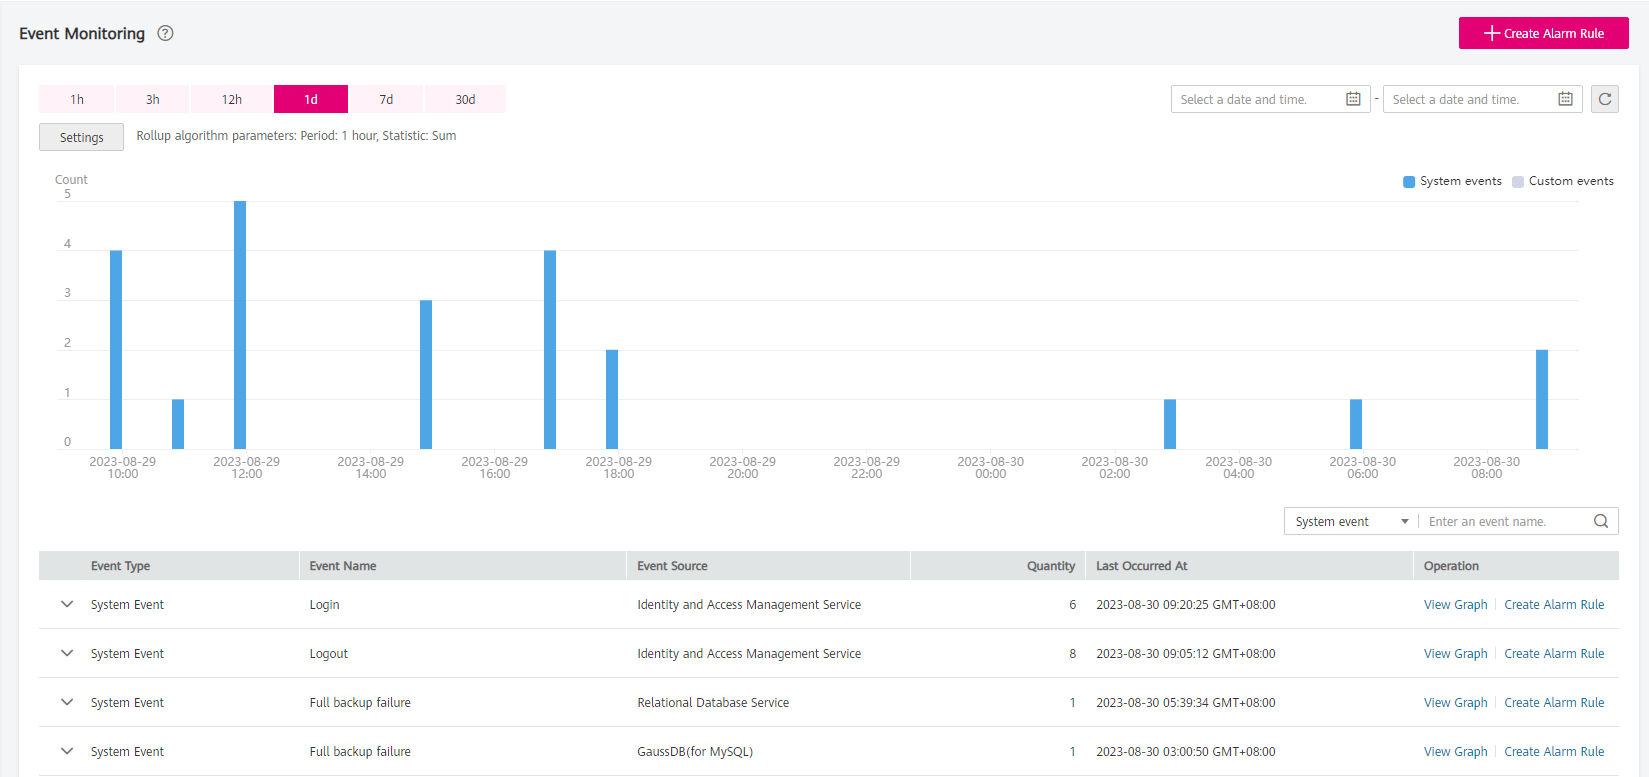
On the displayed Event Monitoring page, all system events generated in the last 24 hours are displayed by default.
You can view events in the last 1 hour, last 3 hours, last 12 hours, last 24 hours, last 7 days, or last 30 days. Alternatively, you can set a custom time range to view events triggered within that period.

Figure 1 Event Monitoring
Expand an event and click View Event in the Operation column to view its details.

Figure 2 Viewing event details
In the row containing the target event, click View Graph in the Operation column. Then, you can view the monitoring data of last 24 hours.
You can view monitoring data of a specified event in the last 1 hour, last 3 hours, last 12 hours, last 24 hours, last 7 days, or last 30 days. Alternatively, you can set a custom time range by specifying the start time and end time to view monitoring data of a specified event within that period.
In the upper right corner of the event list, select an event type and enter an event name to filter the desired event.
To view events of a specific time period, click the corresponding bar chart.