Dashboard
This section describes how to view event logs in a specified time (for example, today), including attack and request statistics, the number of attacks from the top 5 source IP addresses, and event distribution.
Prerequisites
Login credentials have been obtained.
Procedure
Log in to the management console.
Click
 in the upper left corner of the management console and select a region or project.
Choose Security > Web Application Firewall to go to the Dashboard page.
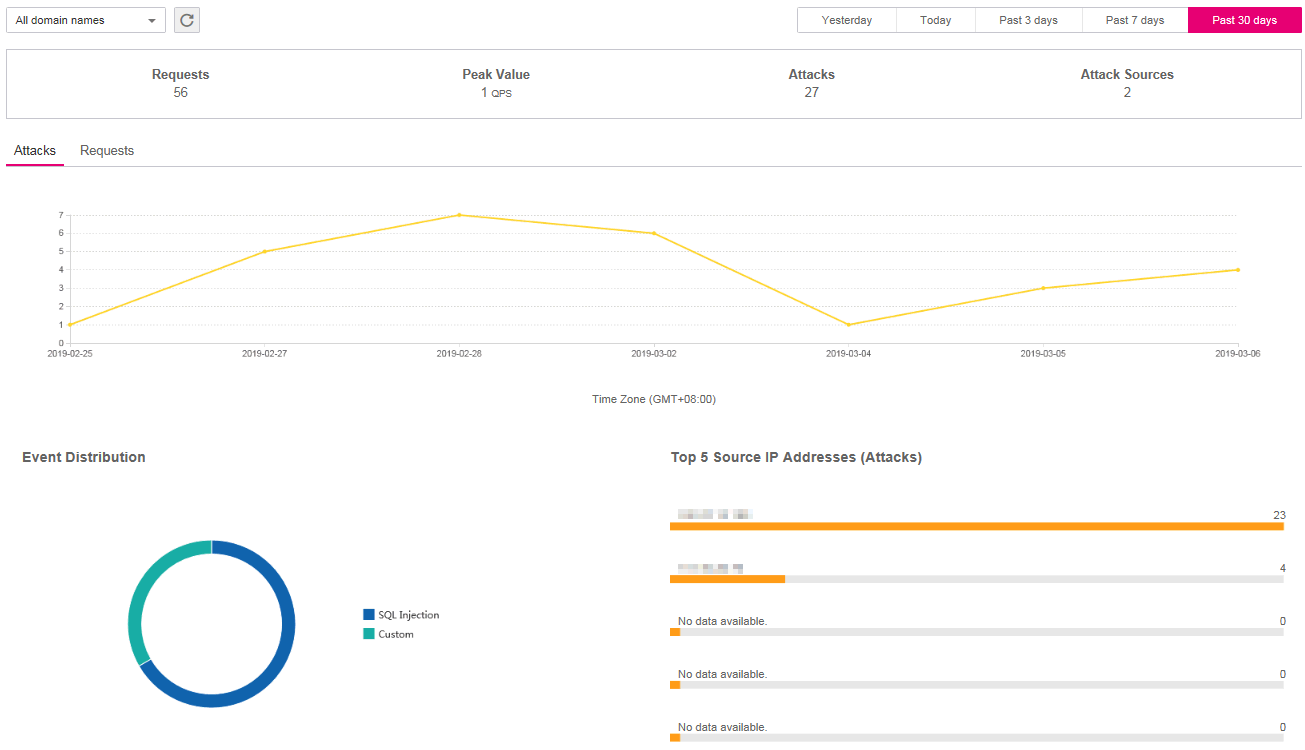
In the domain name drop-down list, select a domain name to view its event logs. The query time can be Yesterday, Today, Past 3 days, Past 7 days, and Past 30 days. Figure 1 shows an example.
Note
You can select All domain names or a specific domain name from the drop-down list.

Figure 1 Viewing event logs
Table 1 Parameter description of event logs¶ Parameter
Description
Remarks
Requests
Total number of requests to the specified domain name
If All domain names is selected, the total number of requests to all domain names is displayed.
N/A
Peak Value
Maximum number of requests to the specified domain name per second
N/A
Attacks
Number of attacks on the specified domain name
N/A
Attack Sources
Number of sources that attack the specified domain name
N/A
Attacks
Trend of attacks
The trend of attacks is displayed by default.
Requests
Trend of requests
Click Requests to view the trend of requests.
Event Distribution
Types of attack events
Click any colored area in the event distribution circle under Event Distribution to view the type, number, and proportion of an attack.
To stop displaying information about a specific type of event, click the corresponding legend with the same color to the right of the circle.
Top 5 Source IP Addresses (Attacks)
Top 5 attack source IP addresses and their cumulative number of attacks
N/A