User Guide for the Open Telekom Cloud Status Dashboard
Accessing the Status Website
Visit the Status Website at https://status.otc-service.com/.
Selecting Regions
The platform supports multiple regions. Use the appropriate tab to select your desired region (e.g., “EU-DE” for Germany, “EU-NL” for the Netherlands, or “GLOBAL” for global services) to check service availability in that area.
Service Status
Services are grouped into categories such as Compute, Network, or Storage. Each service is accompanied by an icon (also known as a semaphore) indicating its current status:
 Green: Service fully operational
 Yellow: Minor Incident - Service is available but may have minor restrictions or reduced performance
 Red-orange: Major Incident - Service is partially available but may cause noticeable impact or interruptions
 Red: Service Outage - Service is unresponsive or facing serious issues
 Green with a dot: Upcoming planned maintenance
 Blue wrench: Ongoing maintenance
 Information: Inform about relevant product information


Auto-update / refresh of the dashboard
The dashboard automatically refreshes every minute. A green dot at the bottom of the page indicates that the update is functioning properly. 
Incident / Maintenance Displays
Current events appear as follows:
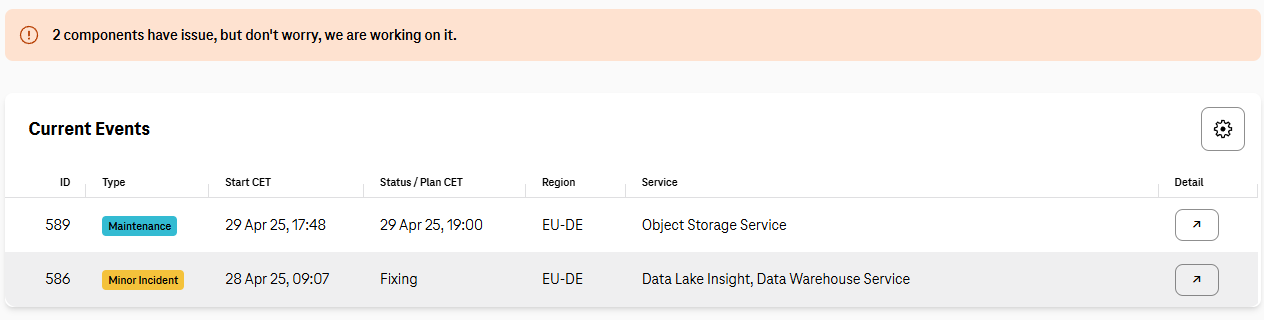
use the gear icon
 to adjust the display settings according to your preferences.
click the arrow icon
 to navigate to a detailed view of the event.


For incidents, we regularly provide updates to our customers via the status dashboard.
History
Access “History” via the top navigation bar to explore a comprehensive record of past incidents.
Component Availability
Note
Service outages directly impact the availability metrics.
The Status Dashboard is designed to track and report the health and performance of external Open Telekom Cloud APIs. It regularly checks configured endpoints, collects timing and status data, and emits structured metrics to help teams monitor API availability, latency, and reliability.
OTC App
Another method is to use the Open Telekom Cloud App, which allows you to receive push notifications in case of status changes.
Tips for Effective Use
Bookmark the status website for quick access during troubleshooting.
Leverage incident history to identify recurring issues and explore potential optimizations.
Customize notifications by region and service using the platform's alert settings.
Happy monitoring!