Viewing CTS Traces
Log in to the management console.
Click
 in the upper left corner to select a region and a project.
Click Service List and choose Management & Deployment > Cloud Trace Service.
Choose Trace List in the navigation pane on the left.
On the displayed page, you can query traces by setting the filtering criteria. The following filters are available:
Trace Source, Resource Type, and Search By
Select the filter from the drop-down list.
When you select Trace name for Search By, you also need to select a specific trace name. When you select Resource ID for Search By, you also need to select or enter a specific resource ID. When you select Resource name for Search By, you also need to select or enter a specific resource name.
Operator: Select a user who performs operations.
Trace Status: Available options include All trace statuses, normal, warning, and incident. You can only select one of them.
Time range: You can specify the time period to query traces.
Click
 on the left of the required trace to expand its details.
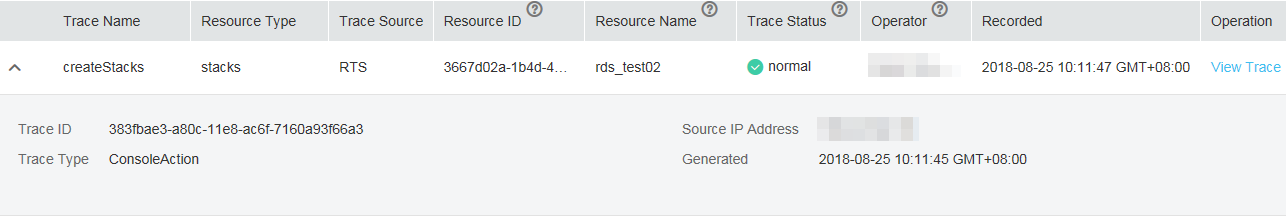
Figure 1 Trace details
Locate a trace and click View Trace in the Operation column. A dialog box is displayed, showing the trace structure details.
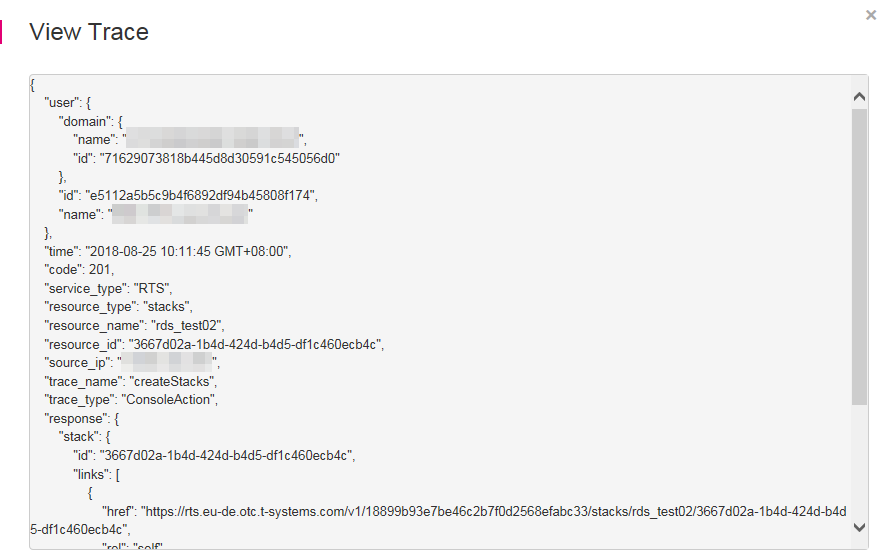
Figure 2 Viewing trace
For details about the key fields in the CTS trace structure, see the Cloud Trace Service User Guide.