Viewing and Downloading Slow Query Logs
Scenarios
Slow query logs record statements that exceed long_query_time (1 second by default). You can view log details to identify statements that are executing slowly and optimize the statements. You can also download slow query logs for service analysis.
Parameter Description
Parameter | Description |
|---|---|
long_query_time | Specifies how many microseconds a SQL query has to take to be defined as a slow query log. The default value is 1s. When the execution time of an SQL statement exceeds the value of this parameter, the SQL statement is recorded in slow query logs. You can modify the slow log threshold as required.
|
 in the Threshold of Slow Query Log (long_query_time) field to change the threshold.
 .
. .
.Viewing Slow Query Logs
Log in to the management console.
Click
 in the upper left corner and select a region and a project.
Click Service List. Under Database, click Relational Database Service. The RDS console is displayed.
On the Instances page, click the target DB instance.
In the navigation pane on the left, choose Logs. On the Slow Query Logs page, click
 to enable the slow query log function.
The generated slow query logs are displayed.
Note
Enabling slow query log slightly affects DB instance performance.
Connect to the DB instance through the Microsoft SQL Server client.
After the DB instance is connected, run the following command to view slow query log details:
select * from ::fn_trace_gettable('D:\SQLTrace\audit\XXX', default)
Note
XXX indicates the name of the slow query log recorded in 6.
Example:
select * from ::fn_trace_gettable('D:\SQLTrace\audit\SQLTrace.trc', default)
The result is shown in Figure 1.
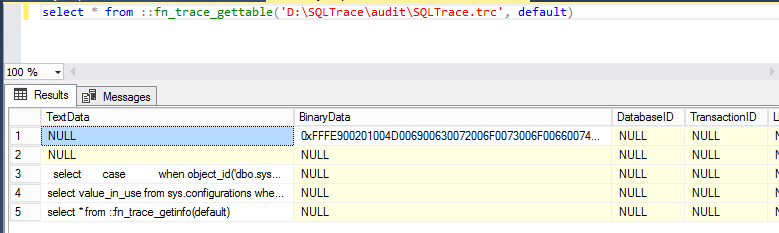
Figure 1 Slow query log details
Downloading a Log
Log in to the management console.
Click
in the upper left corner and select a region and a project.Click Service List. Under Database, click Relational Database Service. The RDS console is displayed.
On the Instances page, click the target DB instance.
In the navigation pane on the left, choose Logs. On the Slow Query Logs page, click
 to enable the slow query log function.
Note
Enabling slow query log slightly affects DB instance performance.
Locate a log to be downloaded and click Download in the Operation column.
The system automatically loads the downloading preparation tasks. The loading duration is determined by the log file size and network environment.
When the log is being prepared for download, the log status is Preparing.
When the log is ready for download, the log status is Preparation completed.
If the preparation for download fails, the log status is Abnormal.
In the displayed dialog box, click OK to download the log whose status is Preparation completed. If you click Cancel, the system does not download the log.
The download link is valid for 5 minutes. After the download link expires, a message is displayed indicating that the download link has expired. You can close the window and repeat the procedure 6 to try to download a log again.
Note
After downloading slow query logs to a local PC, you can use SSMS to connect to the local database and run the following SQL statement to view the slow query log details:
select * from ::fn_trace_gettable('XXX', default)
In the preceding command, XXX indicates the local path for storing slow query logs.