Distribution
Log in to FusionInsight Manager and choose Hosts > Resource Overview. On the Resource Overview page that is displayed, click the Distribution tab to view resource distribution of each cluster. By default, the monitoring data of the past one hour (1h) is displayed. You can click  to customize a time range. Time range options are 1h, 2h, 6h, 12h, 1d, 1w, and 1m.
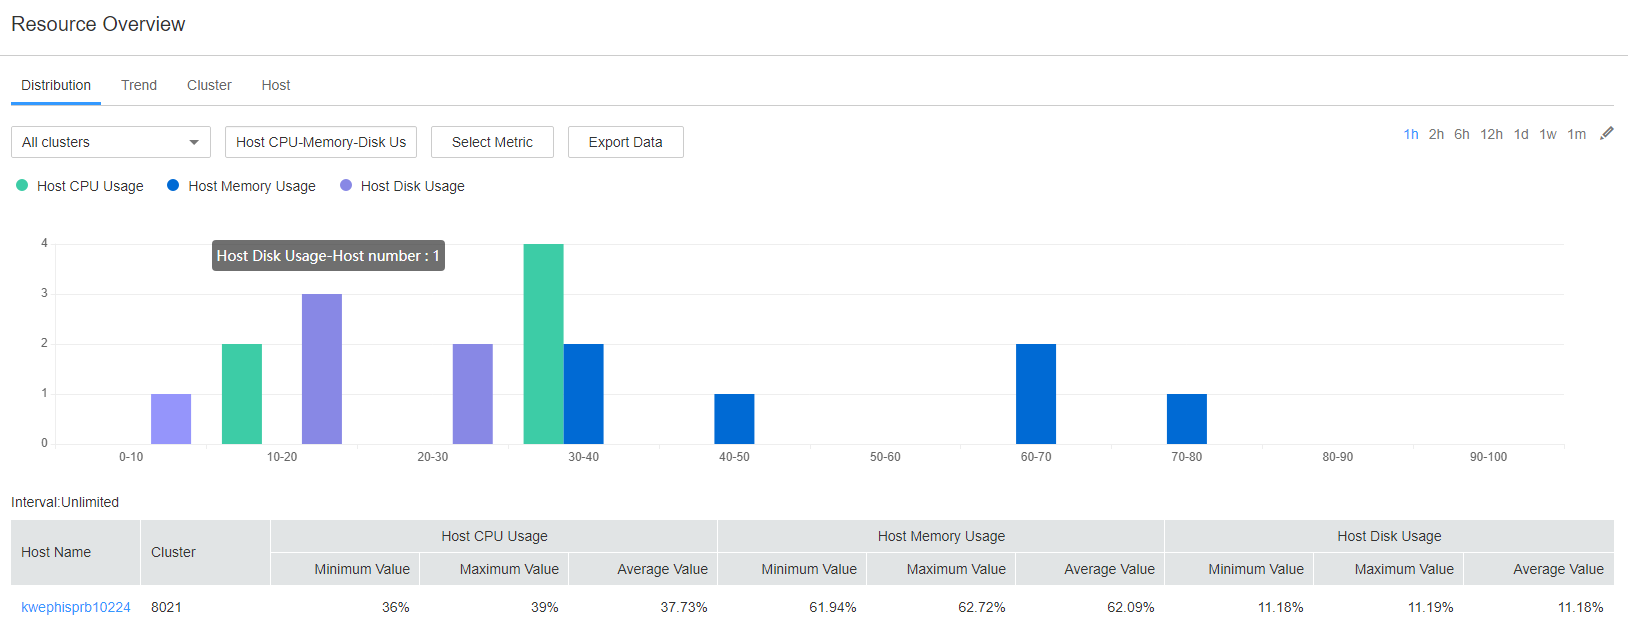
Figure 1 Distribution tab
You can click Select Metric to customize the metric to monitor. Table 1 describes all the metrics that you can select. After you select a metric, the host distribution in each range of the metric is displayed.
When you hover your cursor over a color column, the number of hosts in the current metric range is displayed. See Figure 1. You can click a color column to view the list of hosts in the metric range.
You can click a host name in the Host Name column to access the host details page.
You can click View Trends in the Operation column of a host to view the maximum, minimum, and average values of the current metric in the cluster as well as the value of the current host. In the current cluster, if you have selected Host CPU-Memory-Disk Usage, View Trends is unavailable.
You can click Export Data to export the maximum, minimum, and average values of the current metric of all nodes in the cluster within the time range you have specified.
Category | Metric |
|---|---|
Process |
|
Network Status |
|
Network Reading |
|
Disk |
|
Memory |
|
Network Writing |
|
CPU |
|
Host Status |
|