ALM-12180 Suspended Disk I/O
Description
For HDDs, the alarm is triggered when any of the following conditions is met:
The system collects data every 3 seconds, and detects that the svctm value exceeds 6s for 10 consecutive periods within 30 seconds.
The system collects data every 3 seconds, and detects that the avgqu-sz value is greater than 0, the IOPS or bandwidth is 0, and the ioutil value is greater than 99% for 10 consecutive periods within 30 seconds.
For SSDs, the alarm is triggered when any of the following conditions is met:
The system collects data every 3 seconds, and detects that the svctm value exceeds 2s for 10 consecutive periods within 30 seconds.
The system collects data every 3 seconds, and detects that the avgqu-sz value is greater than 0, the IOPS or bandwidth is 0, and the ioutil value is greater than 99% for 10 consecutive periods within 30 seconds.
This alarm is automatically cleared when the preceding conditions have not been met for 90s.
Note
Run the following command in the OS to collect data:
iostat -x -t 1 1
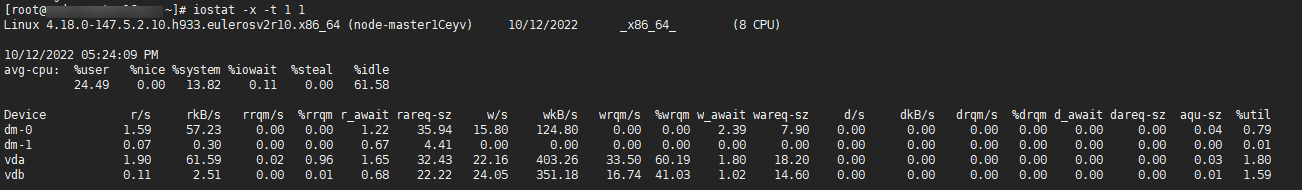
Parameters are as follows:
avgqu-sz indicates the disk queue depth.
The sum of r/s and w/s is the IOPS.
The sum of rkB/s and wkB/s is the bandwidth.
%util is the ioutil value.
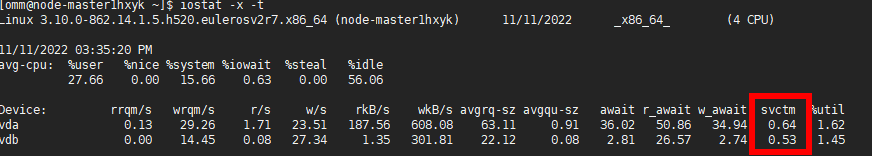
MRS 3.1.0:
Run the iostat -x -t command in the OS.
Calculate svctm as follows in versions later than MRS 3.1.0:
svctm = (tot_ticks_new - tot_ticks_old)/(rd_ios_new + wr_ios_new - rd_ios_old - wr_ios_old)
If rd_ios_new + wr_ios_new - rd_ios_old - wr_ios_old is 0, then svctm is 0.
The parameters can be obtained as follows:
The system runs the cat /proc/diskstats command every 3 seconds to collect data. For example:
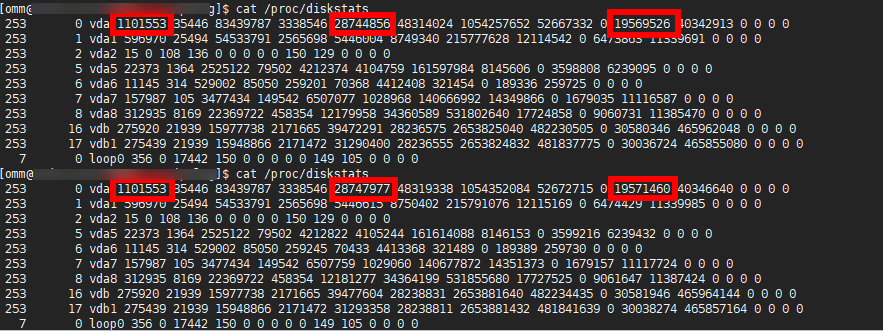
In these two commands:
In the data collected for the first time, the number in the fourth column is the rd_ios_old value, the number in the eighth column is the wr_ios_old value, and the number in the thirteenth column is the tot_ticks_old value.
In the data collected for the second time, the number in the fourth column is the rd_ios_new value, the number in the eighth column is the wr_ios_new value, and the number in the thirteenth column is the tot_ticks_new value.
In this case, the value of svctm is as follows:
(19571460 - 19569526)/(1101553 + 28747977 - 1101553 - 28744856) = 0.6197
Attribute
Alarm ID | Alarm Severity | Auto Clear |
|---|---|---|
12180 | Major | Yes |
Parameters
Name | Meaning |
|---|---|
Source | Specifies the cluster or system for which the alarm is generated. |
ServiceName | Specifies the service for which the alarm is generated. |
RoleName | Specifies the role for which the alarm is generated. |
HostName | Specifies the host for which the alarm is generated. |
DiskName | Specifies the disk for which the alarm is generated. |
Impact on the System
A continuously high I/O usage may adversely affect service operations and result in service loss.
Possible Causes
The disk is aged.
Procedure
Replace the disk.
Log in to FusionInsight Manager and choose O&M > Alarm > Alarms.
View the detailed information about the alarm. Check the values of HostName and DiskName in the location information to obtain the information about the faulty disk for which the alarm is reported.
Replace the hard disk.
Check whether the alarm is cleared.
If yes, no further action is required.
If no, go to 5.
Collect fault information.
On FusionInsight Manager, choose O&M. In the navigation pane on the left, choose Log > Download.
Select OMS for Service and click OK.
Click
 in the upper right corner, and set Start Date and End Date for log collection to 10 minutes ahead of and after the alarm generation time, respectively. Then, click Download.
Contact O&M personnel and provide the collected logs.
Alarm Clearing
This alarm is automatically cleared after the fault is rectified.