ALM-12045 Read Packet Dropped Rate Exceeds the Threshold
Description
The system checks the read packet dropped rate every 30 seconds. This alarm is generated when the read packet dropped rate exceeds the threshold (the default threshold is 0.5%) for multiple times (the default value is 5).
To change the threshold, choose O&M > Alarm > Thresholds > Name of the desired cluster > Host > Network Reading > Read Packet Dropped Rate.
This alarm is cleared when Trigger Count is 1 and the read packet dropped rate is less than or equal to the threshold. This alarm is cleared when Trigger Count is greater than 1 and the read packet dropped rate is less than or equal to 90% of the threshold.
The alarm detection is disabled by default. If you want to enable this function, check whether this function can be enabled based on Checking System Environments.
Attribute
Alarm ID | Alarm Severity | Auto Clear |
|---|---|---|
12045 | Major | Yes |
Parameters
Name | Meaning |
|---|---|
Source | Specifies the cluster or system for which the alarm is generated. |
ServiceName | Specifies the service for which the alarm is generated. |
RoleName | Specifies the role for which the alarm is generated. |
HostName | Specifies the host for which the alarm is generated. |
PortName | Specifies the network port for which the alarm is generated. |
Trigger Condition | Specifies the threshold for triggering the alarm. |
Impact on the System
The service performance deteriorates or some services time out.
Risk warning: In SUSE kernel 3.0 or later or Red Hat 7.2, the system kernel modifies the mechanism for counting the number of dropped read packets. In this case, this alarm may be generated even if the network is running properly, but services are not affected. You are advised to check the system environment first.
Possible Causes
An OS exception occurs.
The NICs are bonded in active/standby mode.
The alarm threshold is improperly configured.
The network quality is poor.
Procedure
View the network packet dropped rate.
On FusionInsight Manager, choose O&M > Alarm > Alarms. On the page that is displayed, click
 in the row containing the alarm, and view the name of the host for which the alarm is generated and the NIC name.
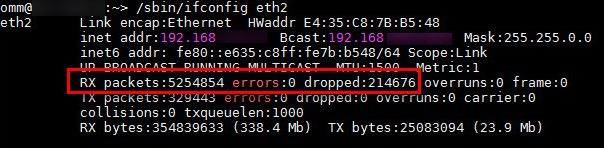
Log in to the alarm node as user omm, and run the /sbin/ifconfig NIC name command to check whether packet loss occurs on the network.
Note
IP address of the node for which the alarm is generated: Query the IP address of the node for which the alarm is generated on the Hosts page of FusionInsight Manager based on the value of HostName in the alarm location information. Check both the IP addresses of the management plane and service plane.
Packet loss rate = (Number of dropped packets/Total number of received packets) x 100%. If the packet loss rate is greater than the system threshold (0.5% by default), read packets are dropped.
Check the system environment.
Log in to the active OMS node or the alarm node as user omm.
Run the cat /etc/*-release command to check the OS type.
Run the cat /etc/redhat-release command to check whether the OS version is Red Hat 7.2 (x86) or Red Hat 7.4 (TaiShan).
# cat /etc/redhat-release
Red Hat Enterprise Linux Server release 7.2 (Santiago)
Run the cat /proc/version command to check whether the SUSE kernel version is 3.0 or later.
# cat /proc/version
Linux version 3.0.101-63-default (geeko@buildhost) (gcc version 4.3.4 [gcc-4_3-branch revision 152973] (SUSE Linux) ) #1 SMP Tue Jun 23 16:02:31 UTC 2015 (4b89d0c)
Log in to FusionInsight Manager and choose O&M > Alarm > Threshold Configuration.
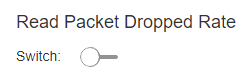
In the navigation tree of the Thresholds page, choose Name of the desired cluster > Host > Network Reading > Read Packet Dropped Rate. In the area on the right, check whether the Switch is toggled on.
In the area on the right, toggle Switch off to disable the checking of Network Read Packet Dropped Rate Exceeds the Threshold.
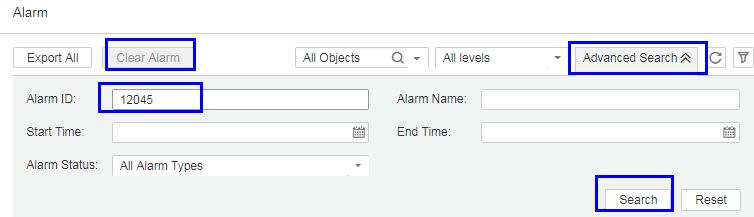
On the Alarm page of FusionInsight Manager, search for alarm 12045 and manually clear the alarm if it is not automatically cleared. No further action is required.
Note
ID of the Network Read Packet Dropped Rate Exceeds the Threshold alarm is 12045.
Check whether the NICs are bonded in active/standby mode.
Log in to the alarm node as user omm and run the ls -l /proc/net/bonding command to check whether the /proc/net/bonding directory exists on the node.
Run the cat /proc/net/bonding/bond0 command to check whether the value of Bonding Mode in the configuration file is fault-tolerance.
Note
In the command, bond0 indicates the name of the bond configuration file. Use the file name obtained in 11.
# cat /proc/net/bonding/bond0
Ethernet Channel Bonding Driver: v3.7.1 (April 27, 2011)

Bonding Mode: fault-tolerance (active-backup)
Primary Slave: eth1 (primary_reselect always)
Currently Active Slave: eth1
MII Status: up
MII Polling Interval (ms): 100
Up Delay (ms): 0
Down Delay (ms): 0

Slave Interface: eth0
MII Status: up
Speed: 1000 Mbps
Duplex: full
Link Failure Count: 1
Slave queue ID: 0

Slave Interface: eth1
MII Status: up
Speed: 1000 Mbps
Duplex: full
Link Failure Count: 1
Slave queue ID: 0
Check whether the NIC specified by NetworkCardName in the alarm is the standby NIC.
If yes, the alarm of the standby NIC cannot be automatically cleared. Manually clear the alarm on the alarm management page. No further action is required.
If no, go to 14.
Note
To determine the standby NIC, check the /proc/net/bonding/bond0 configuration file. If the NIC name corresponding to NetworkCardName is Slave Interface but not Currently Active Slave (the current active NIC), the NIC is the standby one.
Check whether the threshold is set properly.
Log in to FusionInsight Manager, choose O&M > Alarm > Thresholds > Name of the desired cluster > Host > Network Reading > Read Packet Dropped Rate, and check whether the alarm threshold is configured properly. The default value is 0.5%. You can adjust the threshold as needed.
Choose O&M > Alarm > Thresholds > Name of the desired cluster > Host > Network Reading > Read Packet Dropped Rate. Click Modify in the Operation column to change the threshold. See Figure 1.
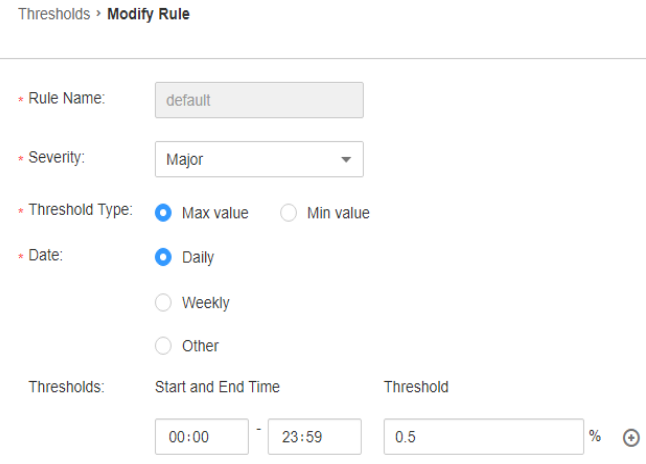
Figure 1 Configuring the alarm threshold
After 5 minutes, check whether the alarm is cleared.
If yes, no further action is required.
If no, go to 17.
Check whether the network connection is normal.
Contact the network administrator to check whether the network is normal.
After 5 minutes, check whether the alarm is cleared.
If yes, no further action is required.
If no, go to 19.
Collect the fault information.
On FusionInsight Manager of the active cluster, choose O&M. In the navigation pane on the left, choose Log > Download.
Select OMS for Service and click OK.
Expand the Hosts dialog box and select the alarm node and the active OMS node.
Click
 in the upper right corner, and set Start Date and End Date for log collection to 30 minutes ahead of and after the alarm generation time respectively. Then, click Download.
Contact O&M personnel and provide the collected logs.
Alarm Clearing
This alarm is automatically cleared after the fault is rectified.