How Do I Understand the Multi-Level Chart Statistics in the HBase Operation Requests Metric?
The following uses the Operation Requests on RegionServers monitoring item as an example:
Log in to MRS Manager and choose Cluster > Services > HBase > Resource. On the displayed page, you can view the Operation Requests on RegionServers chart. If you click all, the top 10 RegionServers ranked by the total number of operation requests in the current cluster are displayed, the statistics interval is 5 minutes.
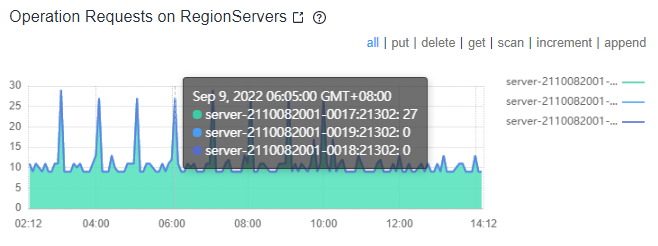
Click a point in the chart. A level-2 chart is displayed, showing the number of operation requests of all RegionServers in the past 5 minutes.
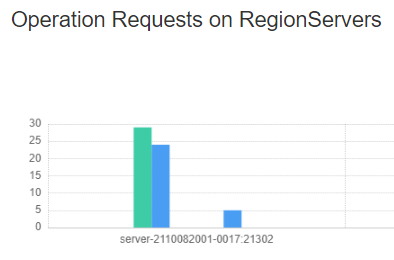
Click an operation statistics bar chart. A level-3 chart is displayed, showing the distribution of operations in each region within the period.
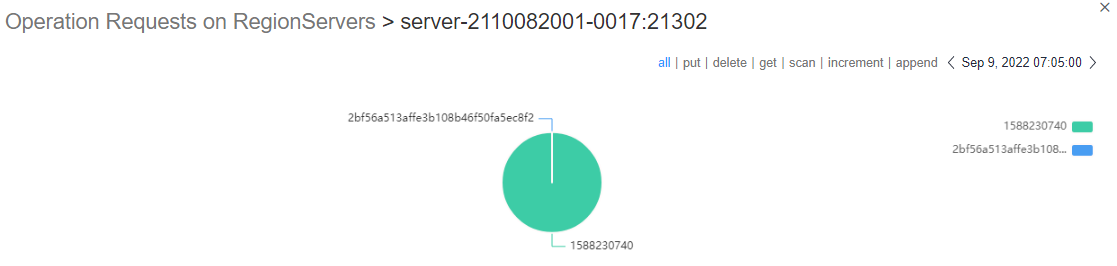
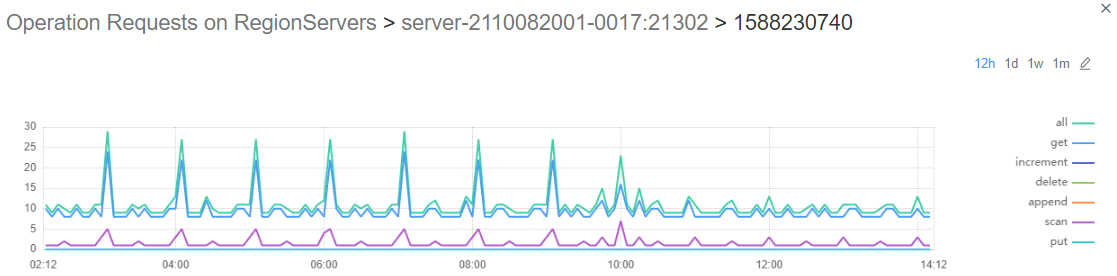
Click a region name. The distribution chart of operations performed every 5 minutes in the last 12 hours is displayed. You can view the number of operations performed in the period.