Resource Statistics
Log resource statistics are classified into read/write traffic, index traffic, and log volume. The statistics are for reference only. You can also visualize log resource statistics in charts.
Read/Write: LTS charges for the amount of compressed log data read from and written to LTS. Generally, the log compression ratio is 5:1.
Indexing: Raw logs are full-text indexed by default for log search.
Log Volume: Space used for storing compressed logs, indexes, and copies is billed. The space is roughly the size of the raw logs.
Yesterday's Statistics
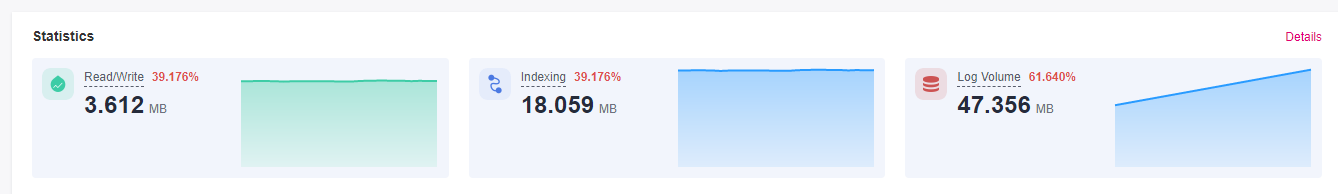
This area shows LTS log resource statistics, day-on-day changes, and data of each hour of the previous day.
The read and write traffic, index traffic, and log volume of the previous day are displayed.
Yesterday's day-on-day changes show a trend.
Trend charts display yesterday's traffic (or log volume) by hour. The interval between two points is one hour. The unit is KB, MB, or GB.
Resource Statistics Details
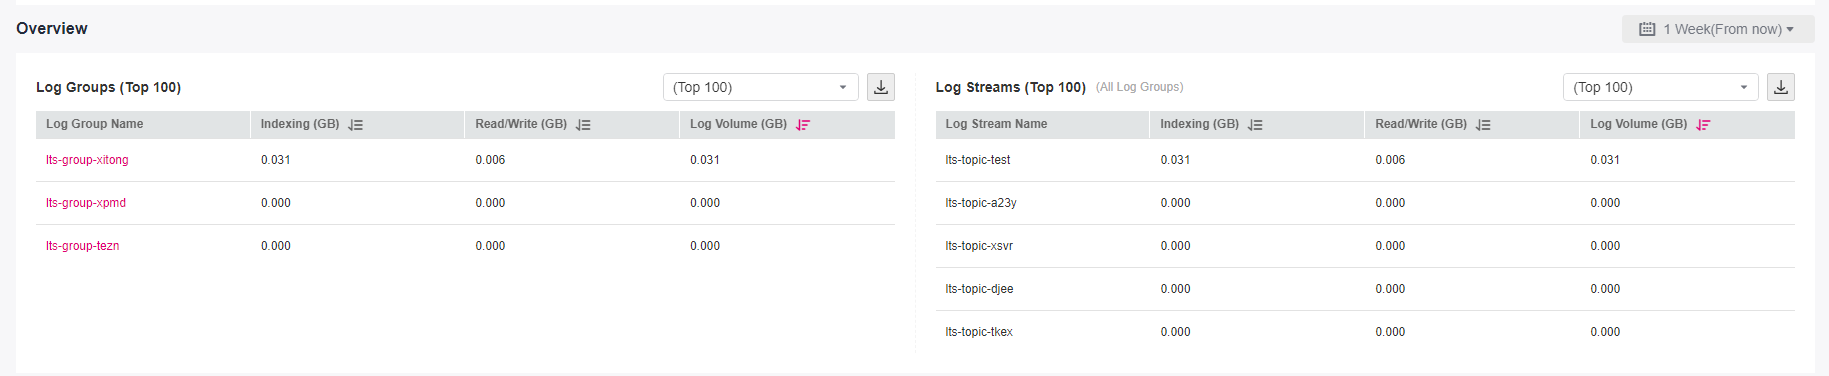
Resource statistics details display the top 100 log groups or log streams by read/write traffic, index traffic, and latest log volume. By default, the log groups or log streams are sorted by the latest log volume (GB). You can also sort the statistics by read/write or index traffic.
For a new log group or log stream, resource statistics will be collected in at least one hour.
Click the name of one of the top 100 log groups to query its log stream resource statistics.
Click
 to download the resource statistics of the target log groups and log streams.
Note
The downloaded resource statistics of the target log groups and log streams files are in .CSV format.
You can select a time range to collect statistics on resource details.
There are three types of time range: relative time from now, relative time from last, and specified time. Select a time range as required.
Note
From now: queries log data generated in a time range that ends with the current time to the second. For example, if the current time is 19:20:31 and 1 hour is selected as the relative time from now, the charts on the dashboard display the log data that is generated from 18:20:31 to 19:20:31.
From last: queries log data generated in a time range that ends with the exact current time to the minute. For example, if the current time is 19:20:31 and 1 hour is selected as the relative time from last, the charts on the dashboard display the log data that is generated from 18:00:00 to 19:00:00.
Specified time: queries log data that is generated in a specified time range.
The daily log volume (GB), daily index traffic (GB), and daily read/write traffic (GB) are displayed based on the selected time range.
There are two display modes:
Table
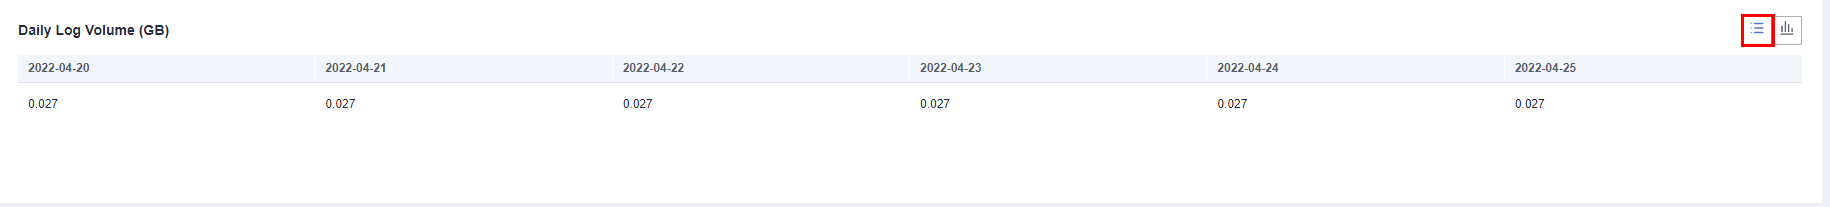
Bar chart
