Log Structuring
Log data can be structured or unstructured. Structured data is quantitative data or can be defined by unified data models. It has a fixed length and format. Unstructured data has no pre-defined data models and cannot be fit into two-dimensional tables of databases.
During log structuring, logs with fixed or similar formats are extracted from a log stream based on your defined structuring method and irrelevant logs are filtered out. You can then use SQL syntax to query and analyze the structured logs.
Prerequisite
You have created a log stream.
Log structuring is recommended when most logs in a log stream share a similar pattern.
Structuring Raw Logs
Add structuring rules to a log stream and LTS will extract logs based on the rules. You can then use the SQL syntax to query logs.
To structure logs:
Log in to the LTS console. In the navigation pane on the left, choose Log Management.
Select a log group and a log stream.
On the log stream details page, click
 in the upper right corner. On the Log Structuring tab, select an extraction method to structure logs.
Regular Expressions: Fields are extracted using regular expressions.
JSON: Key-value pairs are extracted from JSON log events.
Delimiter: Fields are extracted using delimiters (such as commas or spaces).
Nginx: Key-value pairs are extracted from Nginx log events. You can use the log_format directive to define the format of access logs.
Structuring template: Custom and system templates are provided, including templates for VPC, DCS audit logs, Tomcat, and Nginx.
Tag Fields: You can also extract tag fields, which are customizable and are usually host IP addresses or collection paths to show where and when logs were collected. Tag fields are supported for structuring with regular expressions, JSON, delimiters, and Nginx.
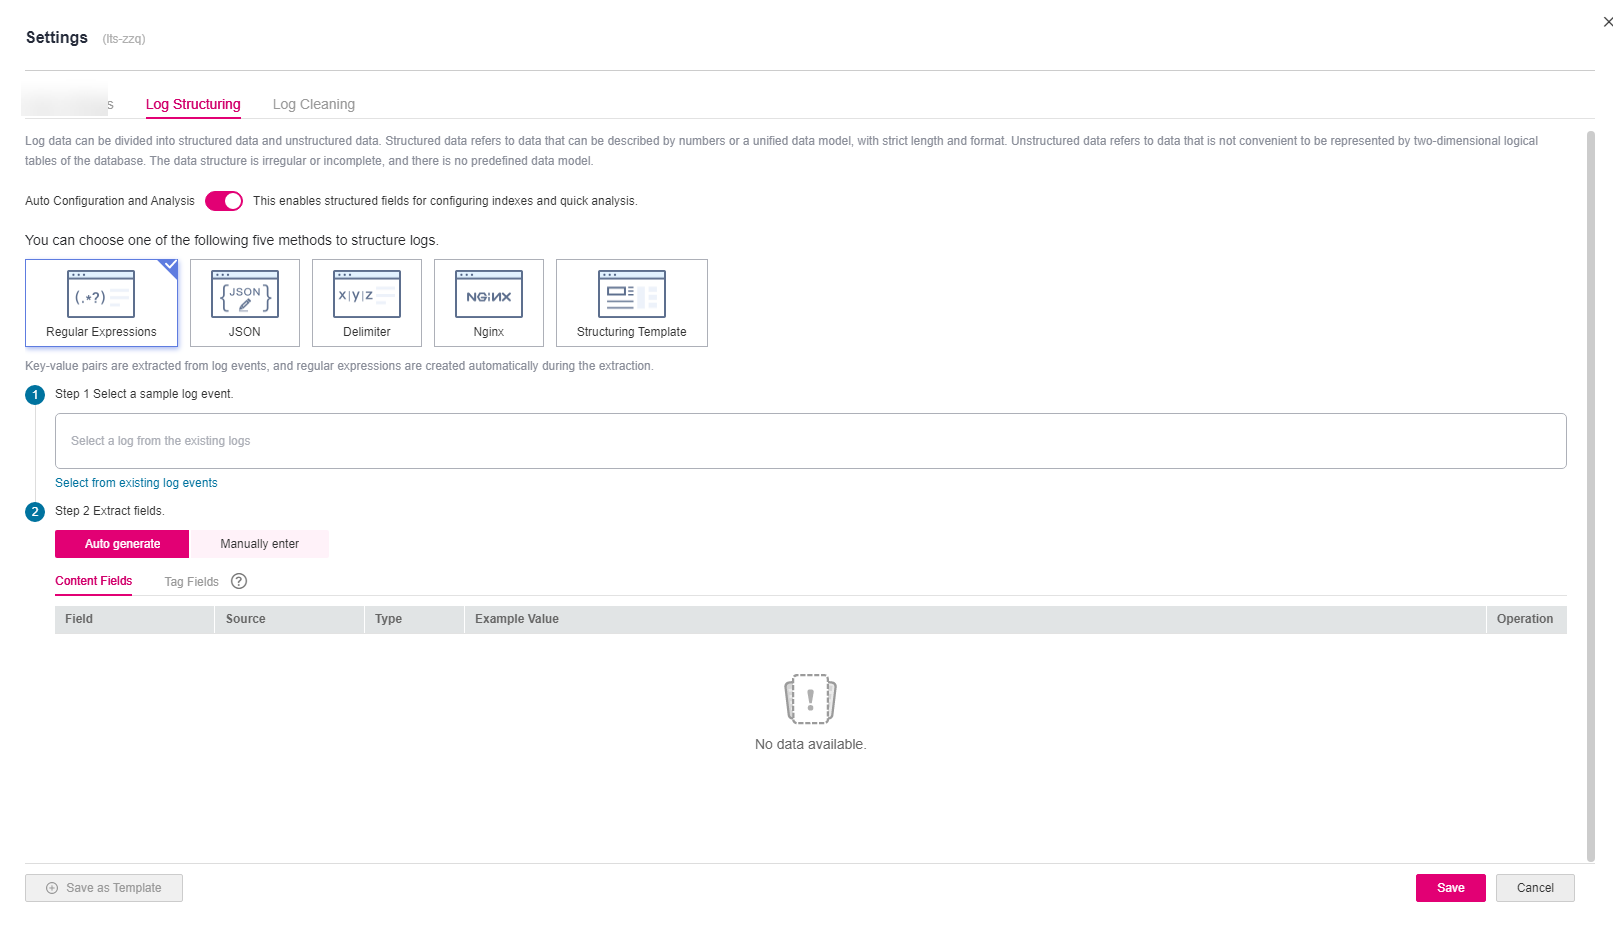
Figure 1 Log structuring
You can then use SQL statements to query structured logs in the same way as you query data in two-dimensional database tables.
Note
If a structured field exceeds 20 KB, only the first 20 KB is retained.
The following system fields cannot be extracted during log structuring: groupName, logStream, lineNum, content, logContent, logContentSize, collectTime, category, clusterId, clusterName, containerName, hostIP, hostId, hostName, nameSpace, pathFile, and podName.
Regular Expressions
Select a typical log event as the sample. Click Select from existing log events, select a log event, and click OK. You can select different time ranges to filter logs.
Note
There are three types of time range: relative time from now, relative time from last, and specified time. Select a time range as required.
From now: queries log data generated in a time range that ends with the current time, such as the previous 1, 5, or 15 minutes. For example, if the current time is 19:20:31 and 1 hour is selected as the relative time from now, the charts on the dashboard display the log data that is generated from 18:20:31 to 19:20:31.
From last: queries log data generated in a time range that ends with the current time, such as the previous 1 or 15 minutes. For example, if the current time is 19:20:31 and 1 hour is selected as the relative time from last, the charts on the dashboard display the log data that is generated from 18:00:00 to 19:00:00.
Specified time: queries log data that is generated in a specified time range.
Extract fields. Extracted fields are shown with their example values. You can extract fields in two ways:
Auto generate: Select the log content you want to extract as a field in the sample log event. In the dialog box displayed, set the field name. The name must start with a letter and contain only letters and digits. Then click Add.
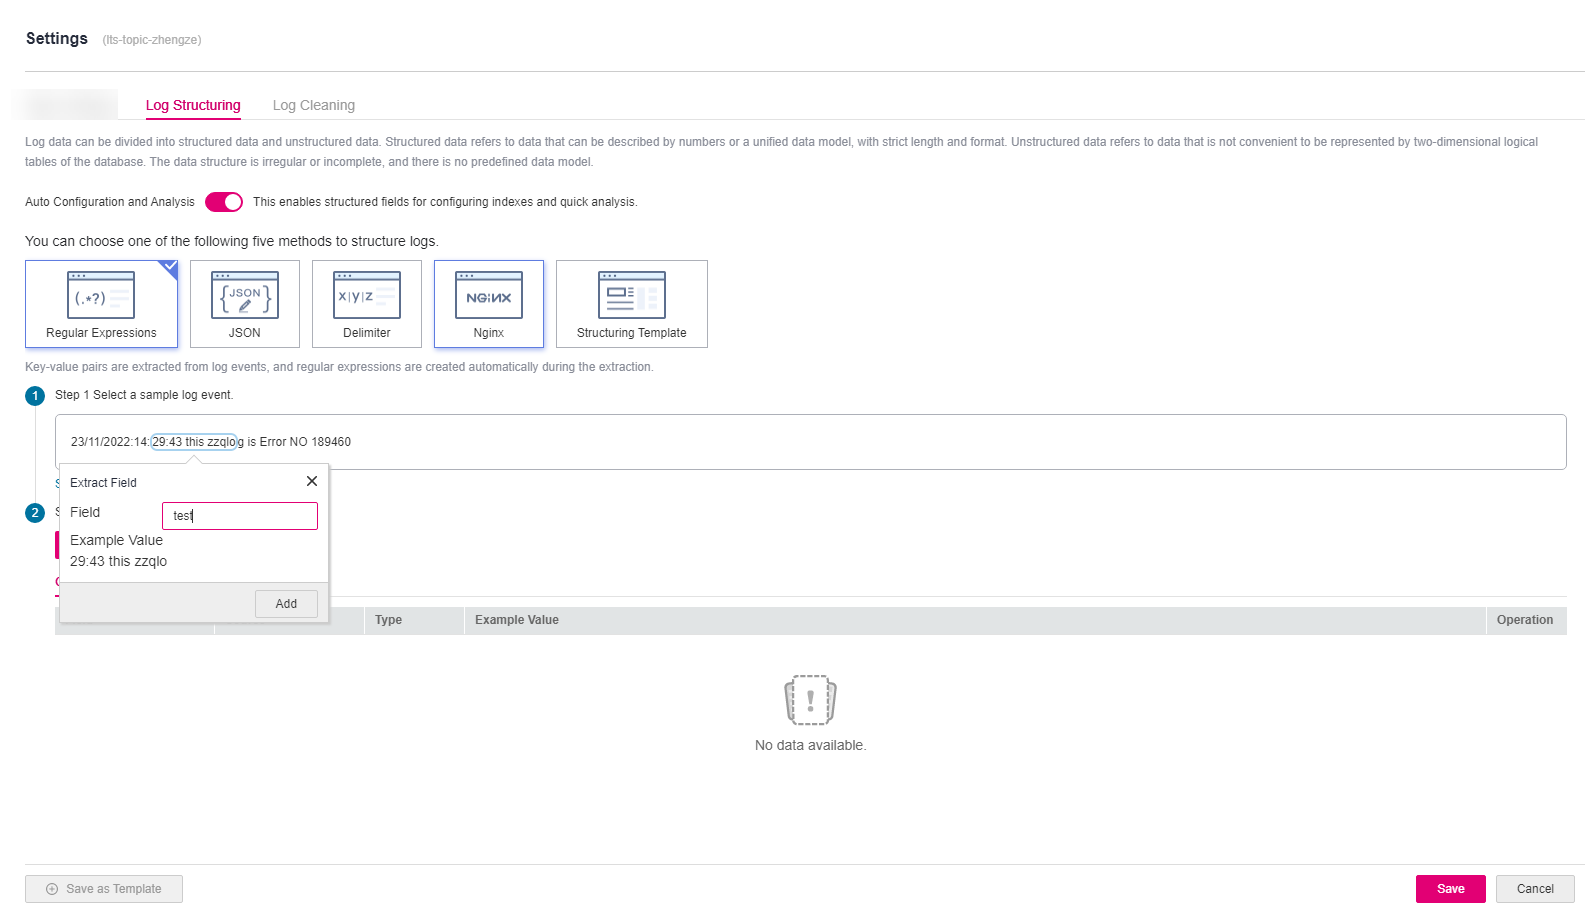
Figure 2 Selecting a field
Manually enter: Enter a regular expression in the text box and click Extract Field. A regular expression may contain multiple capturing groups. Each group is enclosed in a pair of parentheses. There are three types of capturing groups:
(exp): Capturing groups are numbered by counting their opening parentheses from left to right. The numbering starts with 1.
(?<name>exp): named capturing group. It captures text that matches exp into the group name. The group name must start with a letter and contain only letters and digits. A group is recalled by group name or number.
(?:exp): non-capturing group. It captures text that matches exp, but it is not named or numbered and cannot be recalled.
Note
Select a portion between two adjacent delimiters as a field. Default delimiters: , '";=()[]{}@&<>/:\n\t\r
When you select manually enter, the regular expression can contain up to 5000 characters. You do not have to name capturing groups when writing the regular expression. When you click Extract Field, those unnamed groups will be named as field1, field2, field3, and so on.
Check and edit the fields if needed. For details about rules for configuring extracted fields, see Configuring Structured Fields.
Click Save. The type of extracted fields cannot be changed after the structuring is complete.
JSON
Select a typical log event as the sample. Click Select from existing log events, select a log event, or enter a log event in the text box, and click OK. You can select different time ranges to filter logs.
Note
There are three types of time range: relative time from now, relative time from last, and specified time. Select a time range as required.
From now: queries log data generated in a time range that ends with the current time, such as the previous 1, 5, or 15 minutes. For example, if the current time is 19:20:31 and 1 hour is selected as the relative time from now, the charts on the dashboard display the log data that is generated from 18:20:31 to 19:20:31.
From last: queries log data generated in a time range that ends with the current time, such as the previous 1 or 15 minutes. For example, if the current time is 19:20:31 and 1 hour is selected as the relative time from last, the charts on the dashboard display the log data that is generated from 18:00:00 to 19:00:00.
Specified time: queries log data that is generated in a specified time range.
Extract fields. Extract fields from the log event. Extracted fields are shown with their example values.
Click Intelligent Extraction. Take the following log event as an example.
Enter the log event in the text box.
{"record_time":"1632904298988","user":{"domain":{"name":"paas_apm_z00418070_01","id":"1d26cc8c86a840e28a4f8d0d07852f1d"},"assumedBy":{"user":{"domain":{"name":"xxxx","id":"xxxx"},"name":"xxxx","id":"xxxx"}},"name":"paas_apm_z00418070_01/cce_admin_trust"}}
The following fields will be extracted:
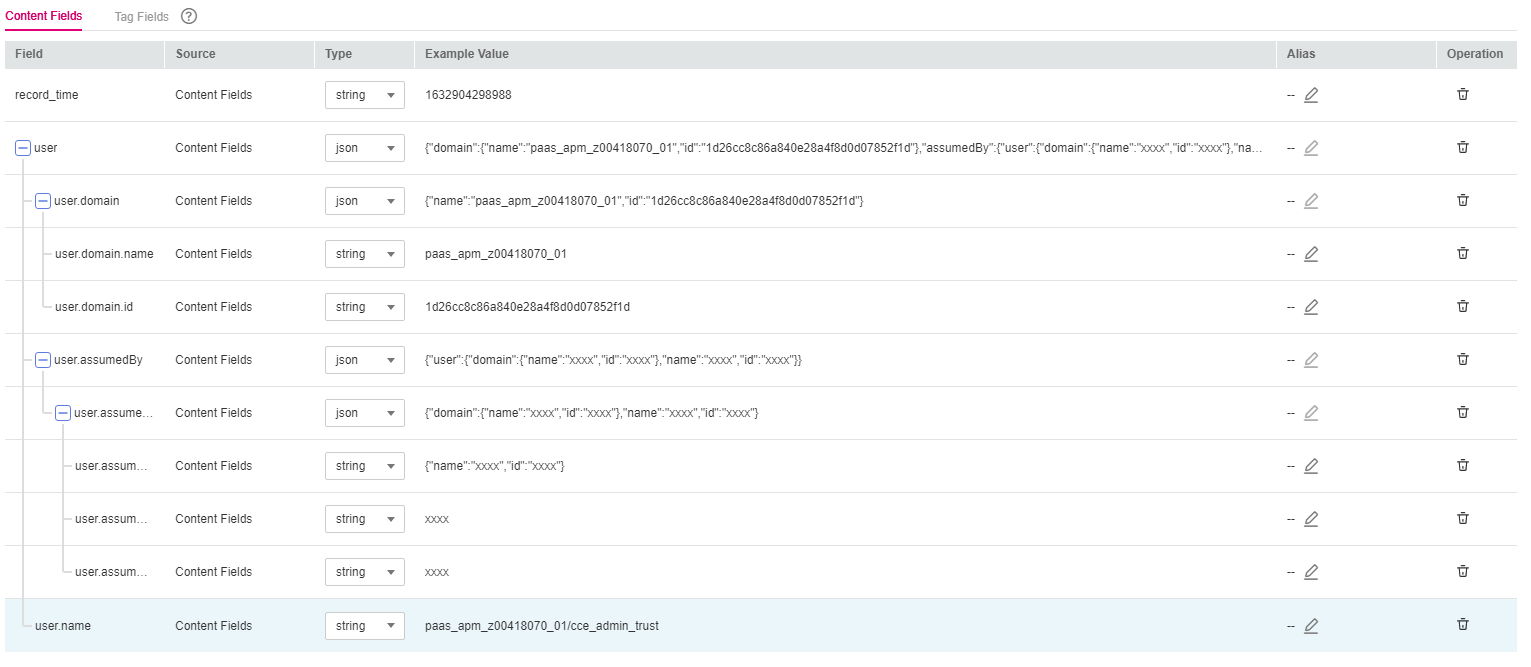
Note
The float data type has seven digit precision.
If a value contains more than seven valid digits, the extracted content is incorrect, which affects visualization and quick analysis. In this case, you are advised to change the field type to string.
Check and edit the fields if needed. For details about rules for configuring extracted fields, see Configuring Structured Fields.
Click Save. The type of extracted fields cannot be changed after the structuring is complete.
Delimiters
Select a typical log event as the sample. Click Select from existing log events, select a log event, or enter a log event in the text box, and click OK. You can select different time ranges to filter logs.
Note
There are three types of time range: relative time from now, relative time from last, and specified time. Select a time range as required.
From now: queries log data generated in a time range that ends with the current time, such as the previous 1, 5, or 15 minutes. For example, if the current time is 19:20:31 and 1 hour is selected as the relative time from now, the charts on the dashboard display the log data that is generated from 18:20:31 to 19:20:31.
From last: queries log data generated in a time range that ends with the current time, such as the previous 1 or 15 minutes. For example, if the current time is 19:20:31 and 1 hour is selected as the relative time from last, the charts on the dashboard display the log data that is generated from 18:00:00 to 19:00:00.
Specified time: queries log data that is generated in a specified time range.
Select a delimiter or define a custom one.
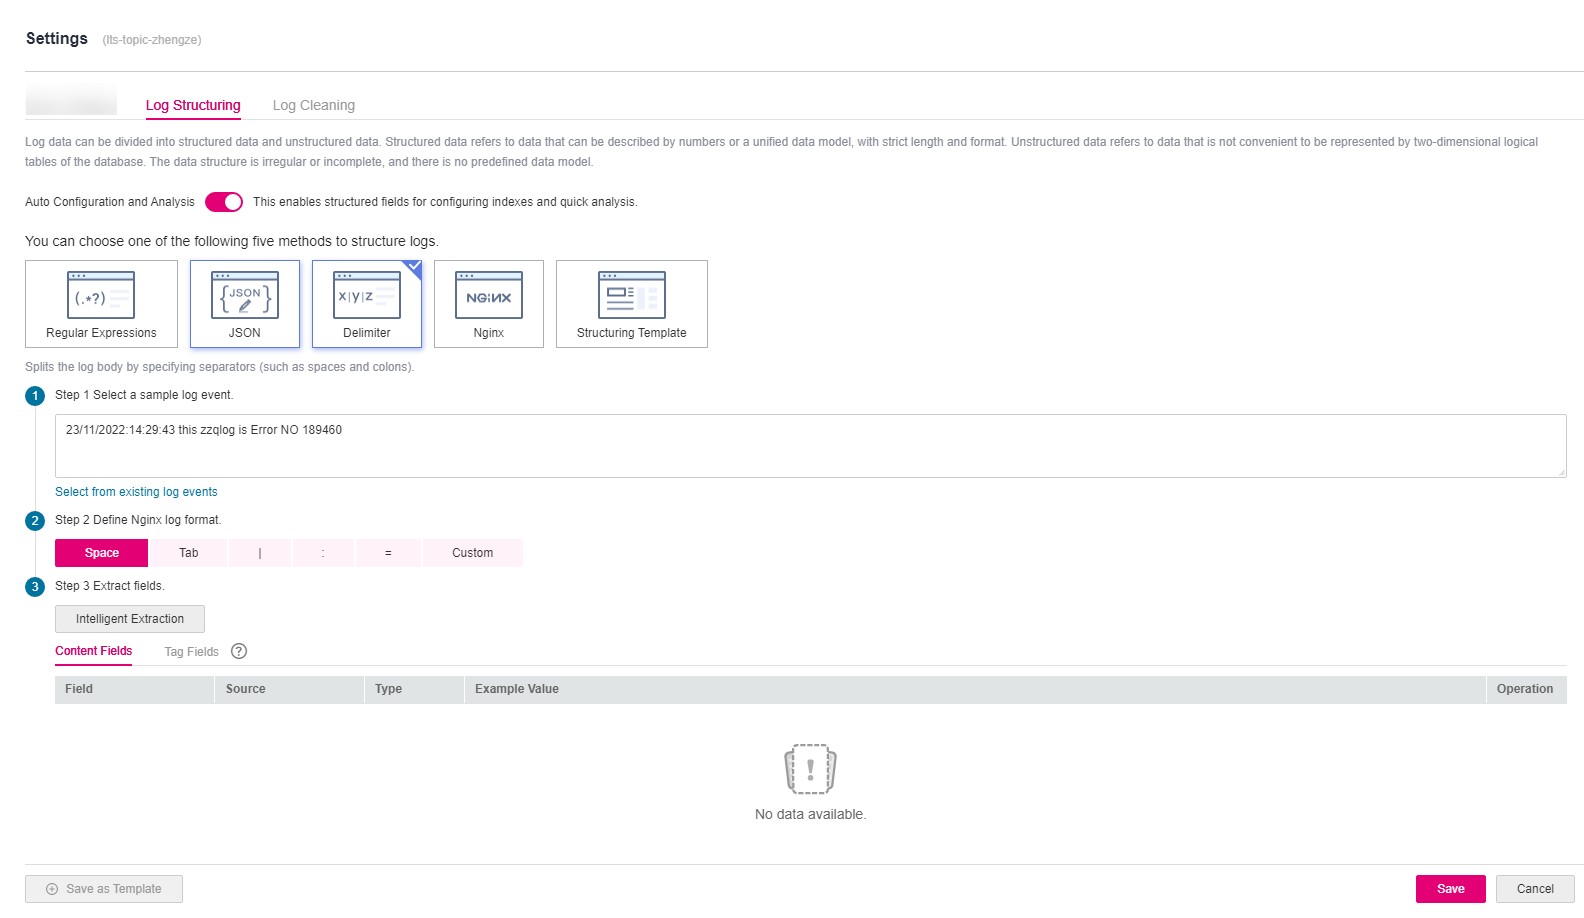
Figure 3 Defining a custom delimiter
Extract fields. Extract fields from the log event. Extracted fields are shown with their example values.
Click Intelligent Extraction. Take the following log event as an example.
Enter the log event in the text box.
1 5f67944957444bd6bb4fe3b367de8f3d 1d515d18-1b36-47dc-a983-bd6512aed4bd 192.168.0.154 192.168.3.25 38929 53 17 1 96 1548752136 1548752736 ACCEPT OK
The following fields will be extracted:
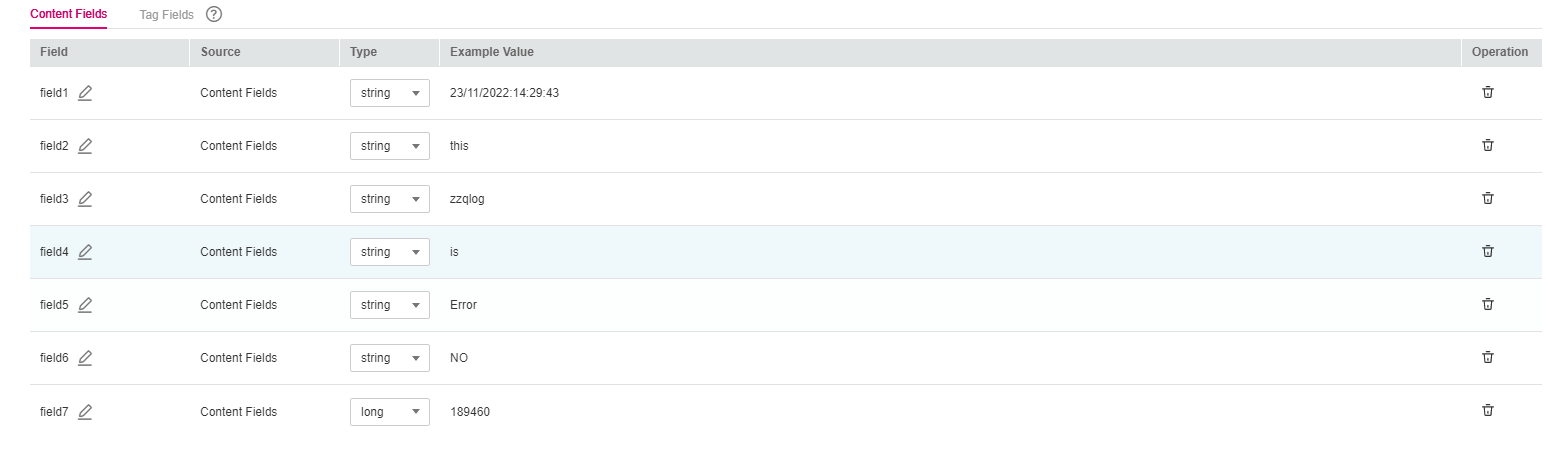
Figure 4 Intelligent extraction results
Note
The float data type has seven digit precision.
If a value contains more than seven valid digits, the extracted content is incorrect, which affects visualization and quick analysis. In this case, you are advised to change the field type to string.
Check and edit the fields if needed. For details about rules for configuring extracted fields, see Configuring Structured Fields.
Click Save. The type of extracted fields cannot be changed after the structuring is complete.
Nginx
Select a typical log event as the sample. Click Select from existing log events, select a log event, or enter a log event in the text box, and click OK. You can select different time ranges to filter logs.
Note
There are three types of time range: relative time from now, relative time from last, and specified time. Select a time range as required.
From now: queries log data generated in a time range that ends with the current time, such as the previous 1, 5, or 15 minutes. For example, if the current time is 19:20:31 and 1 hour is selected as the relative time from now, the charts on the dashboard display the log data that is generated from 18:20:31 to 19:20:31.
From last: queries log data generated in a time range that ends with the current time, such as the previous 1 or 15 minutes. For example, if the current time is 19:20:31 and 1 hour is selected as the relative time from last, the charts on the dashboard display the log data that is generated from 18:00:00 to 19:00:00.
Specified time: queries log data that is generated in a specified time range.
Define the Nginx log format. You can click Apply Default Nginx Log Format to apply the default format.
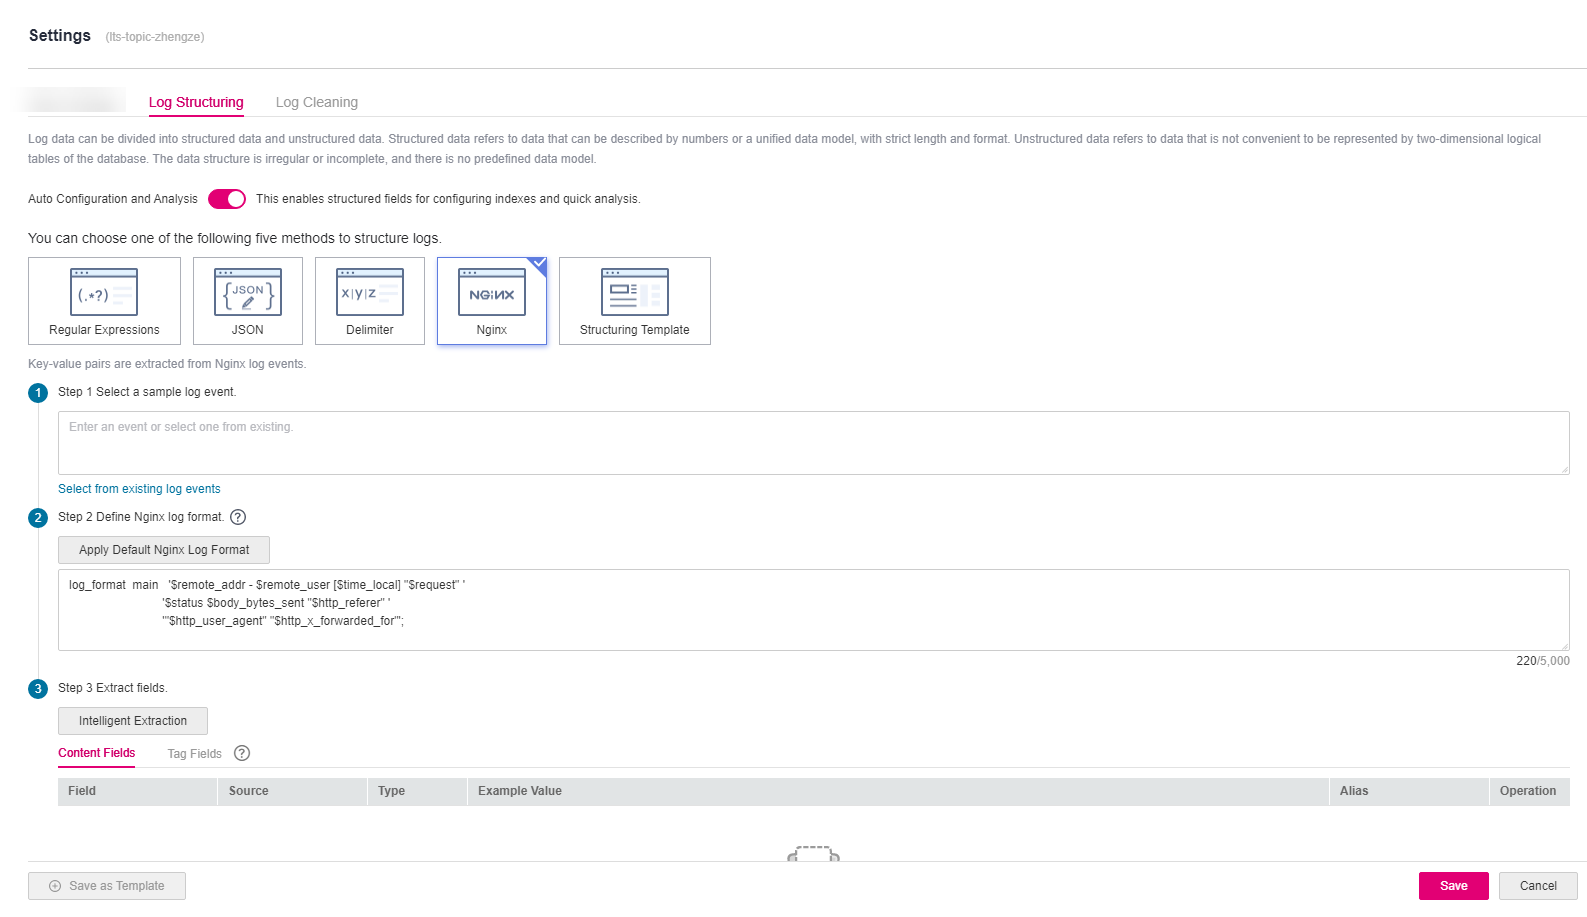
Figure 5 Defining the Nginx log format
Note
In standard Nginx configuration files, the portion starting with log_format indicates the log configuration.
Log format
Default Nginx log format:
log_format  main   '$remote_addr - $remote_user [$time_local] "$request" '
                            '$status $body_bytes_sent "$http_referer" '
                            '"$http_user_agent" "$http_x_forwarded_for"';
You can also customize a format. The format must meet the following requirements:
Cannot be blank.
Must start with log_format and contain apostrophes (') and field names.
Can contain up to 5000 characters.
Must match the sample log event.
Any character except letters, digits, underscores (_), and hyphens (-) can be used to separate fields.
Must end with an apostrophe (') or an apostrophe plus a semicolon (';).
Extract fields. Extract fields from the log event. Extracted fields are shown with their example values.
Click Intelligent Extraction. Take the following log event as an example.
Enter the log event in the text box.
39.149.31.187 - - [12/Mar/2020:12:24:02 +0800] "GET / HTTP/1.1" 304 0 "-" "Mozilla/5.0 (Windows NT 10.0; Win64; x64) AppleWebKit/537.36 (KHTML, like Gecko) Chrome/80.0.3987.132 Safari/537.36" "-"
Also, you have configured the following Nginx log format in step 2:
log_format  main   '$remote_addr - $remote_user [$time_local] "$request" '
                            '$status $body_bytes_sent "$http_referer" '
                            '"$http_user_agent" "$http_x_forwarded_for"';
The following fields will be extracted:
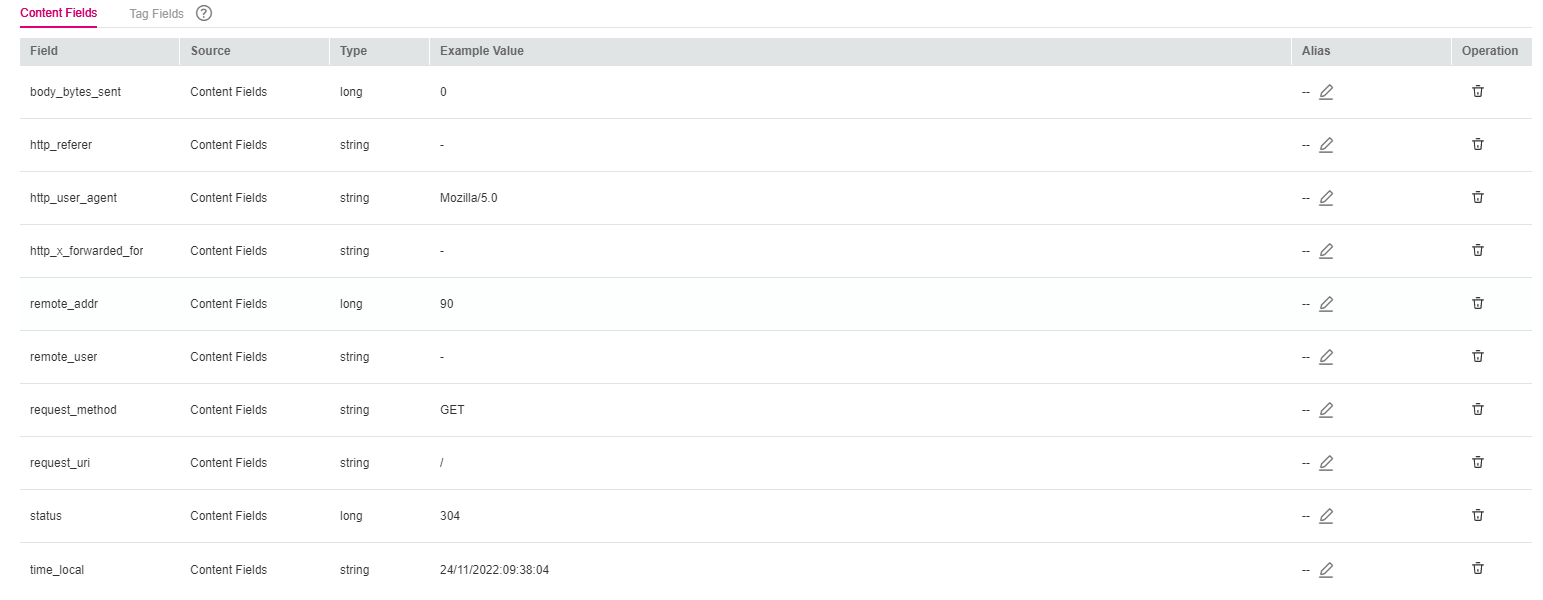
Figure 6 Intelligent extraction results
Note
The float data type has seven digit precision.
If a value contains more than seven valid digits, the extracted content is incorrect, which affects visualization and quick analysis. In this case, you are advised to change the field type to string.
Check and edit the fields if needed. For details about rules for configuring extracted fields, see Configuring Structured Fields.
Click Save. The type of extracted fields cannot be changed after the structuring is complete.
Structuring Templates
System Templates
Select System template, and select a system template for VPC,DCS audit logs, Tomcat, and Nginx. A sample log event is displayed for each template.
When you select a custom template, the log parsing result is displayed in the Template Details area. Click Save.
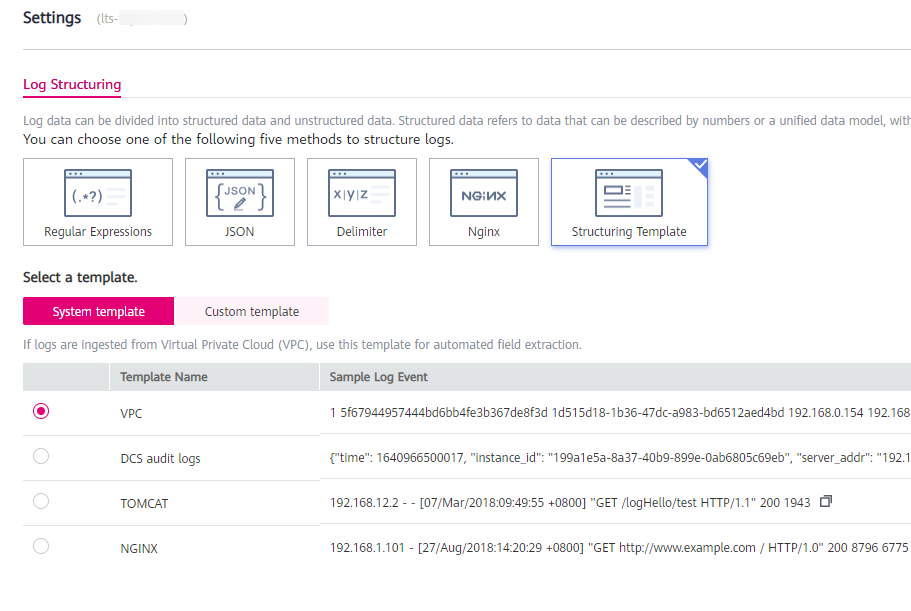
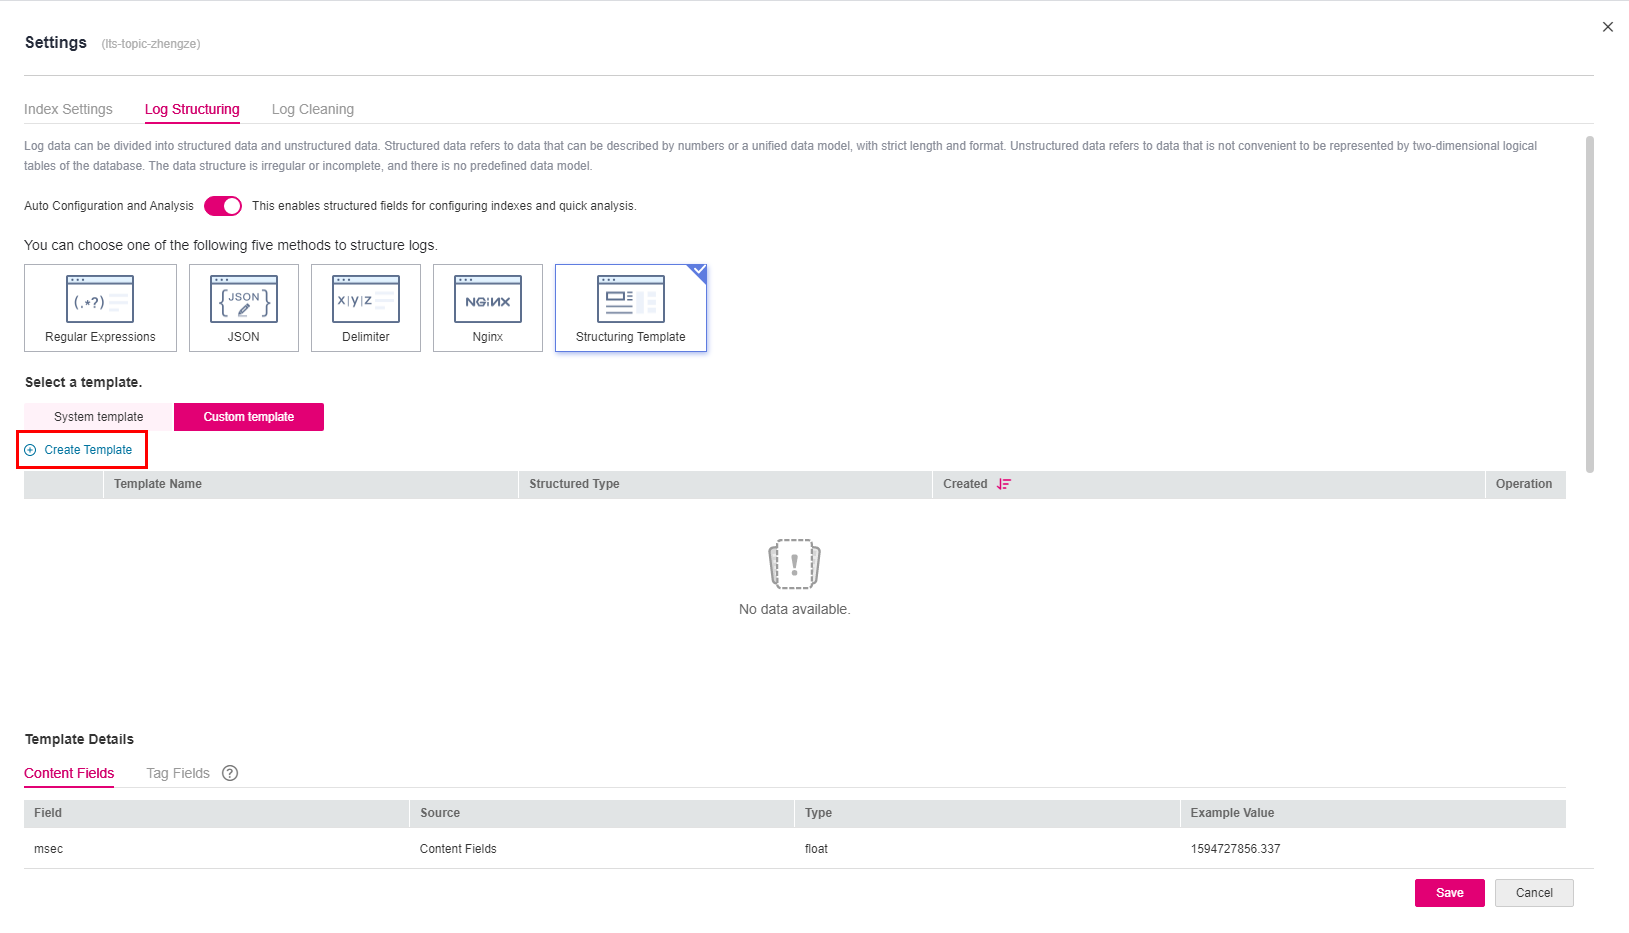
Figure 7 Structuring templates
Custom Templates
Select Custom template and select a custom template. There are two ways to obtain a custom template:
When you extract fields using methods of regular expression, JSON, delimiter, or Nginx, click Save as Template in the lower left corner. In the displayed dialog box, enter the template name and click OK. The template will be displayed in the custom template list.
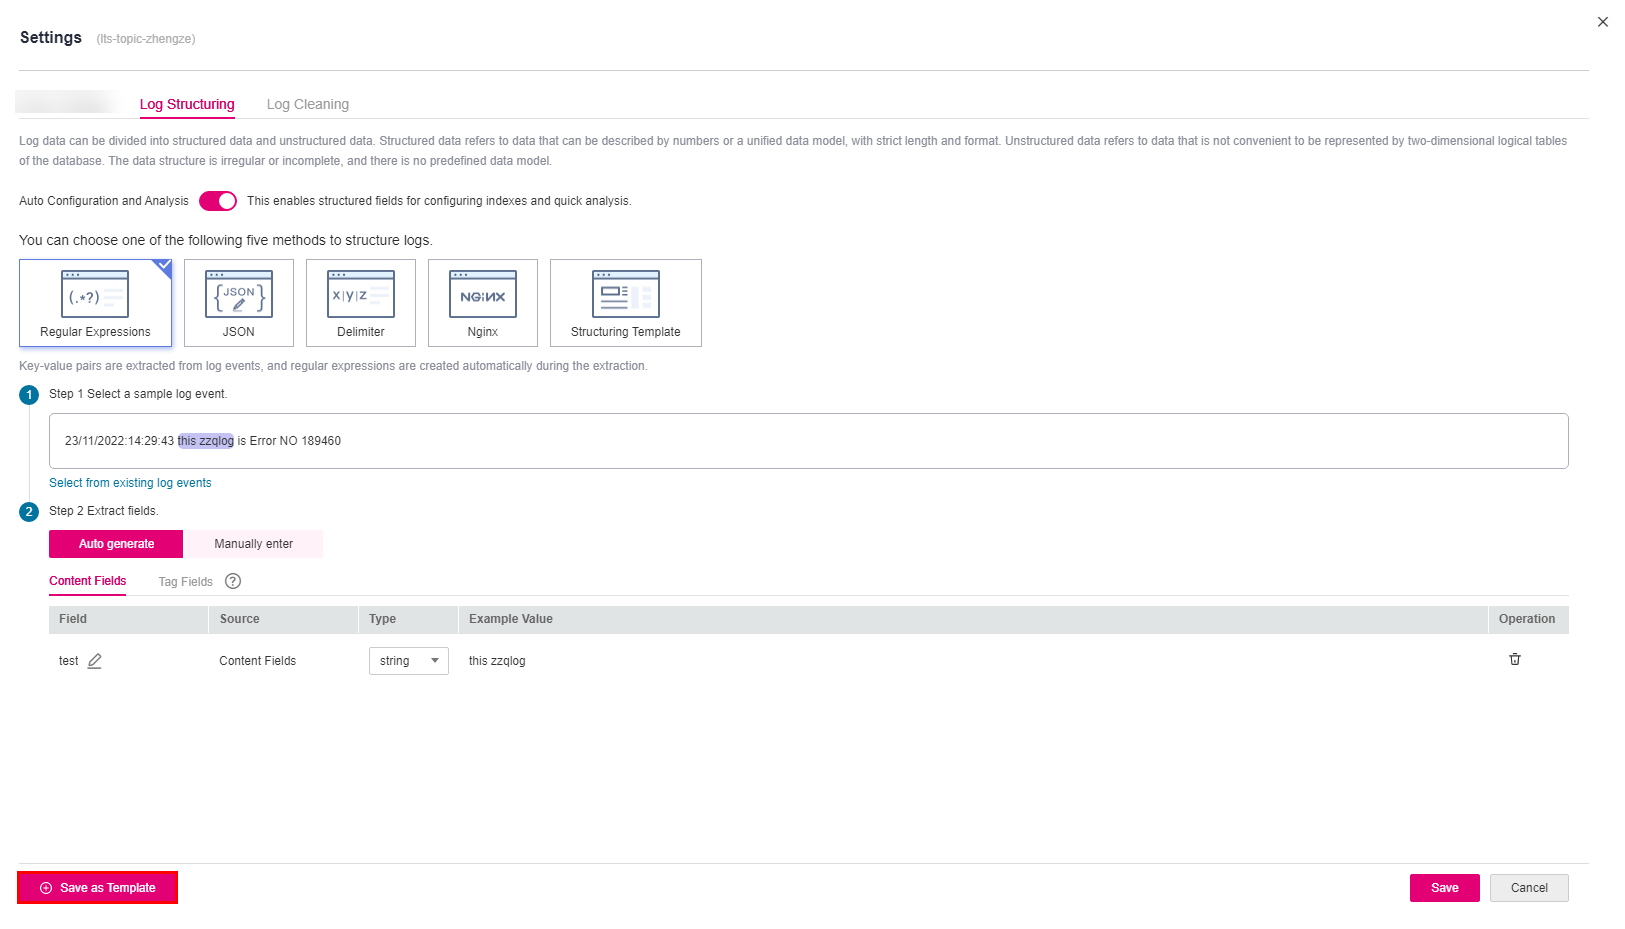
Figure 8 Custom templates
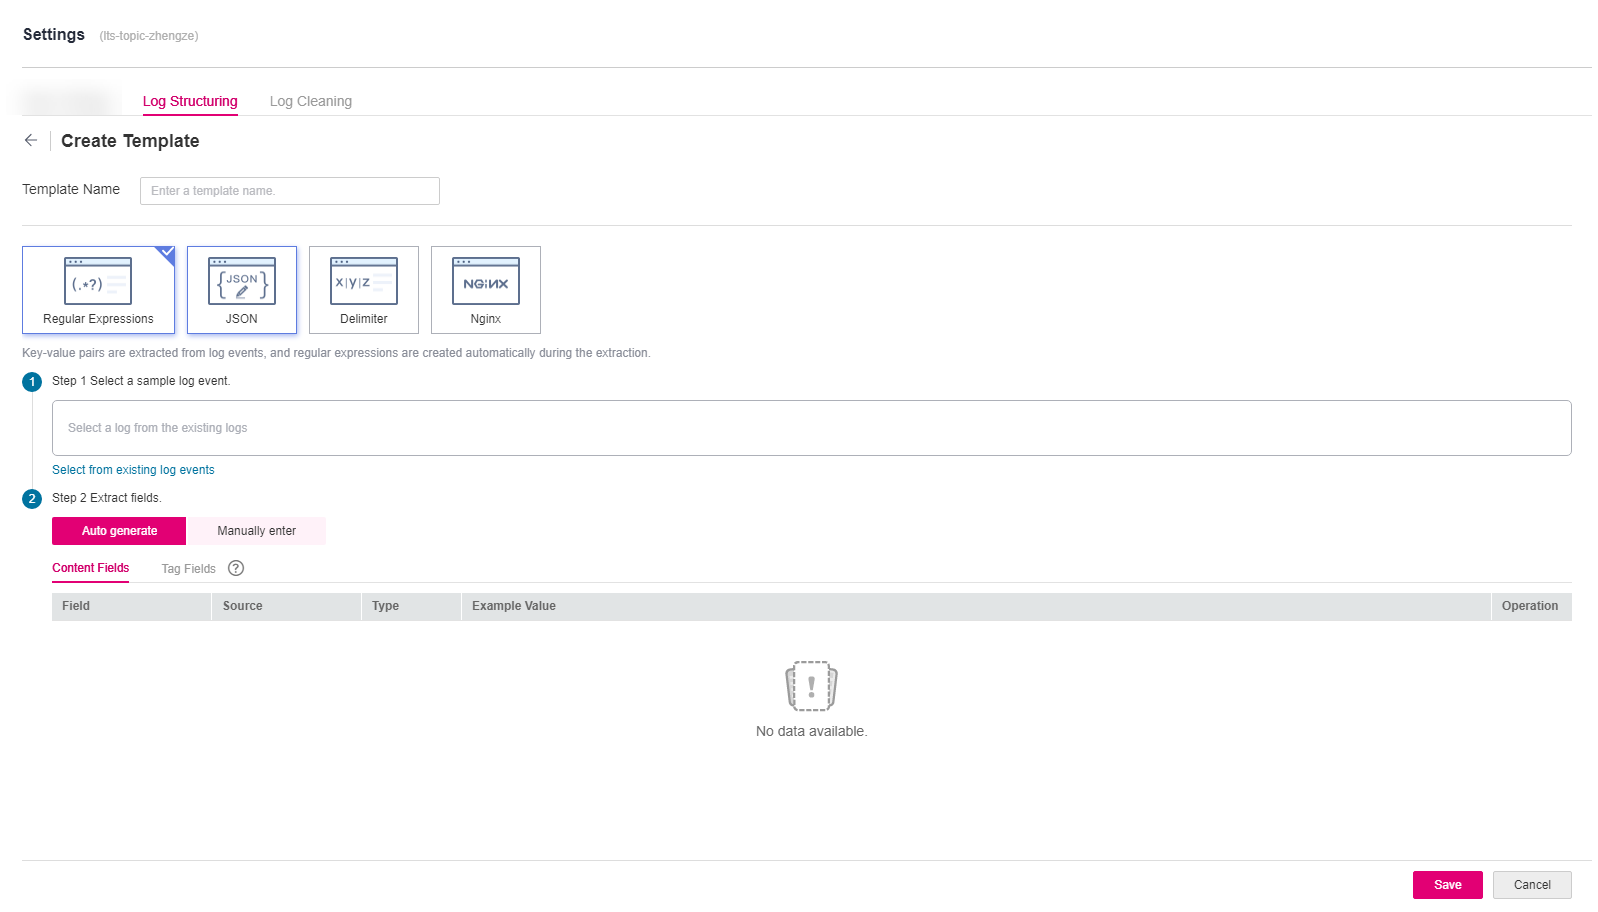
Create a custom template under the Structuring Template option.
Select Custom template and click Create Template. Enter a template name, select Regular Expressions, JSON, Delimiter, or Nginx, configure the template, and click Save. The template will be displayed in the custom template list.
When you select a custom template, the log parsing result is displayed in the Template Details area. Click Save.
You can enable quick analysis for fields if needed.
Note
The float data type has seven digit precision.
If a value contains more than seven valid digits, the extracted content is incorrect, which affects visualization and quick analysis. In this case, you are advised to change the field type to string.
Tag Fields
When you structure logs, you can configure tag fields, so you can use these fields to run SQL queries on the Visualization page.
During field extraction, click the Tag Fields tab.
Click Add Field.
In the Field column, enter the name of the tag field, for example, hostIP.
Click the check mark next to the field name. If the field is a system tag field, it will be identified as System in the Source column.
Note
If you configure tag fields for a structuring rule that was created before the function of tag fields was brought online, no example values will be shown with the tag fields.
To add more fields, click Add Field.
Click Save to save the settings.
Note
Tag fields can be the following system fields: category, clusterId, clusterName, containerName, hostIP, hostId, hostName, nameSpace, pathFile, and podName.
Tag fields cannot be the following system fields: groupName, logStream, lineNum, content, logContent, logContentSize, and collectTime.
Quick analysis is disabled for tag fields by default. You can enable it.
You can configure both field extraction and tag fields during log structuring.
Configuring Structured Fields
You can edit extracted fields after log structuring.
Structuring Method | Field Name | Field Type Can Be Changed | Field Can Be Deleted |
|---|---|---|---|
Regular expressions (auto generate) | User-defined. The name must start with a letter and contain only letters and digits. | Yes | Yes |
Regular expressions (manually enter) |
| Yes | Yes |
JSON | Names are set automatically, but you can set aliases for fields. | Yes | Yes |
Delimiter | Default names such as field1, field2, field3 are used. You can modify these names. | Yes | Yes |
ELB structuring template | Defined by ELB. | No | No |
VPC structuring template | Defined by VPC. | No | No |
CTS structuring template | Keys in JSON log events. | No | No |
APIG structuring template | Defined by APIG. | No | No |
DCS audit logs | Defined by DCS. | No | No |
Tomcat | Defined by Tomcat. | No | No |
Nginx | Defined by Nginx. | No | No |
GAUSSV5 audit logs | Defined by GAUSSV5. | No | No |
DDS audit logs | Defined by DDS. | No | No |
DDS error logs | Defined by DDS. | No | No |
DDS slow query logs | Defined by DDS. | No | No |
CFW access control logs | Defined by CFW. | No | No |
CFW attack logs | Defined by CFW. | No | No |
CFW traffic logs | Defined by CFW. | No | No |
MySQL error logs | Defined by MySQL. | No | No |
MySQL slow query logs | Defined by MySQL. | No | No |
PostgreSQL error logs | Defined by PostgreSQL. | No | No |
SQL Server error logs | Defined by SQL Server. | No | No |
GaussDB(for Redis) slow query logs | Defined by GaussDB(for Redis). | No | No |
Custom template | User-defined. | Yes | Yes |
Note
When you use regular expressions (manually entered), JSON, delimiters, Nginx, or custom templates to structure logs, field names:
Can contain only letters, digits, hyphens (-), underscores (_), and periods (.).
Cannot start with a period (.) or underscore (_) or end with a period (.).
Can contain 1 to 64 characters.