Risk Statistics
On the dashboard page of the HSS console, you can learn the security status and risks of all your servers and containers in real time, including the risk index, risk trend, top 5 event types, and service quota.
Note
If you have enabled the enterprise project function, you can select your enterprise project from the Enterprise project drop-down list to check server risk overview of the project. If you select All projects, the risk overview of servers in all the projects in this region is displayed.
Log in to the management console.
Click
 in the upper left corner of the page, select a region, and choose Security > HSS. The HSS page is displayed.
In the navigation pane, choose Dashboard.
Note
If your servers are managed by enterprise projects, you can select an enterprise project to view or operate the asset and scan information.
Asset Risk Index (Last 24 Hours)
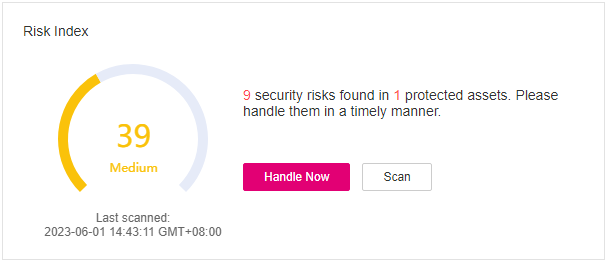
Figure 1 Asset risk index (last 24 hours)
You can check the risks in protected servers and containers in the last 24 Hours.
To handle the risks, click Handle Now. The Risks pane will be displayed on the right. You can handle risks by referring to the corresponding guidance. You can handle the following types of risks:
Intrusions
Vulnerabilities
Unsafe Settings
To check your asset security, click Scan.
Protection Status (Last 24 Hours)
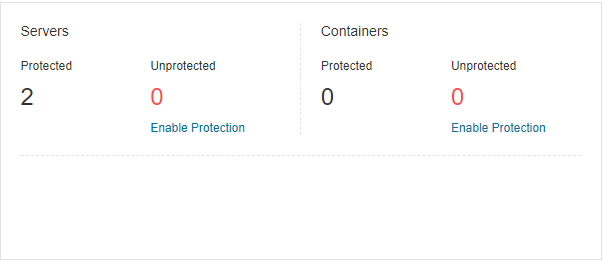
Figure 2 Protection Status
You can check the numbers of protected and unprotected servers and nodes.
To enable protection for a server, click Enable Protection.
Risks (Latest 24 Hours)
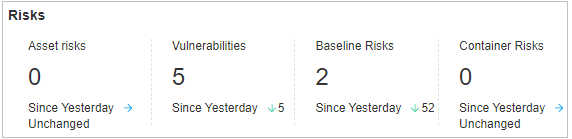
Figure 3 Risks
You can check the number of server asset risks, server vulnerabilities, server baselines, and container risks, and their comparison with the previous day.
Risk Statistics
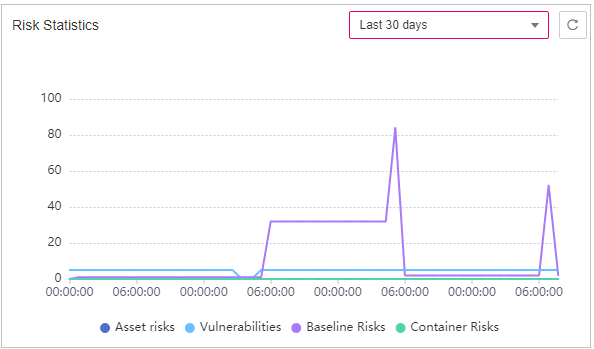
Figure 4 Risk trend
You can check the risk trend in the last 24 hours, last 3 days, last 7 days, and last 30 days.
Category | Event |
|---|---|
Asset risks |
|
Server vulnerabilities |
|
Server baseline risks |
|
Container risks |
|
Intrusions (Last 24 Hours)
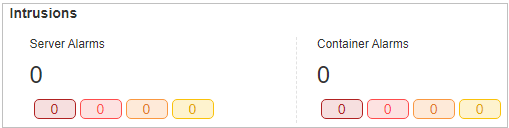
Figure 5 Intrusions (last 24 hours)
You can check the total number of intrusions detected on servers and containers, and the severities of the intrusions.
These intrusion statistics are updated at 00:00 every day.
Top 5 Events
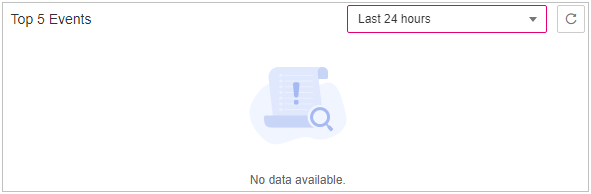
Figure 6 Top 5 events
For servers protected by the enterprise, premium, or container security edition, you can check the top five types of intrusion events detected in the last 24 hours, last 3 days, last 7 days, or last 30 days; and the number of each type of events.
If no data is displayed due to connection problems, fix your network and click  to retrieve data again.
Real-time Alarms
You can check real-time alarms.
Check the latest five unhandled intrusion events in the last 24 hours, including their severities, alarm names, occurrence time, and statuses.
To check alarm details, click an alarm name.
To handle an alarm, click Handle in its Operation column. After the alarm is handled, it will be removed from the list. The list refreshes and displays the latest five intrusion events that have not been handled in the last 24 hours.
To check more alarm events, click View More.