Viewing Server Asset Fingerprints
HSS can collect server asset fingerprints, including information about ports, processes, web applications, web services, web frameworks, and auto-started items. You can centrally check server asset information and detect risky assets in a timely manner based on the server fingerprints. This section describes how to view collected server asset fingerprints on the console.
Prerequisite
HSS enterprise edition, premium edition, WTP edition, or container edition has been enabled for the server.
Viewing Asset Information of All Servers
Log in to the management console.
Click in the upper left corner of the page, select a region, and choose Security > HSS. The HSS page is displayed.
Choose Asset Management > Server Fingerprints to view all server assets.
Delete risky assets in a timely manner. You are advised to handle the ports as follows:
If HSS detects open high-risk ports or unused ports, check whether they are really used by your services.
If a detected high-risk port is actually a normal port used for services, you can ignore it. The port will no longer be regarded risky or generate alarms.
Note
If your servers are managed by enterprise projects, you can select the target enterprise project to view or operate the asset and detection information.
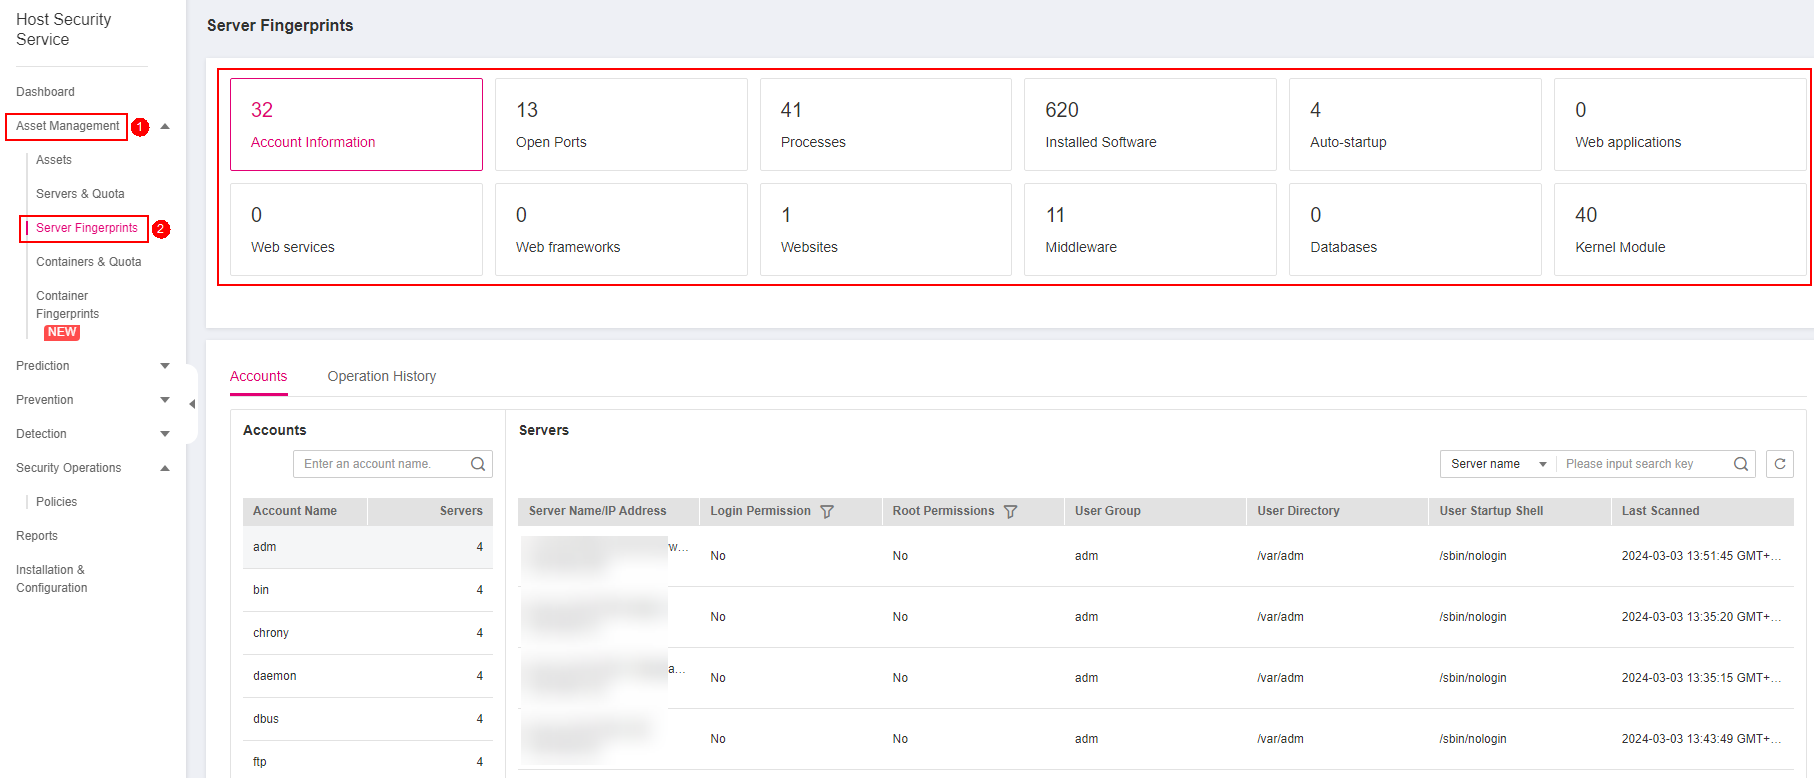
¶ Item
Description
Supported OS
Automatic Detection Period
Account Information
Check and manage all accounts on your servers to keep them secure.
You can check real-time and historical account information to find suspicious accounts.
Real-time account information includes the account name, number of servers, server name/IP address, login permission, root permission, user group, user directory, shell started by the user, and the last scan time.
Historical account change records include the server name/IP address, change status, login permission, root permission, user group, user directory, shell started by the user, and the last scan time.
Linux and Windows
Automatic check every hour
Open Ports
Check open ports on your servers, including risky and unknown ports.
You can easily identify high-risk ports by checking local ports, protocol types, server names, IP addresses, statuses, PIDs, and program files.
Manually disabling high-risk ports
If dangerous or unnecessary ports are found enabled, check whether they are mandatory for services, and disable them if they are not. For dangerous ports, you are advised to further check their program files, and delete or isolate their source files if necessary.
It is recommended that you handle the ports at the Dangerous risk level promptly and handle the ports at the Unknown risk level based on the actual service conditions.
Ignore risks: If a detected high-risk port is actually a normal port used for services, you can ignore it. The port will no longer be regarded risky or generate alarms.
Linux and Windows
Automated check every 30 seconds
Processes
Check processes on your servers and find abnormal processes.
You can easily identify abnormal processes based process paths, server names, IP addresses, startup parameters, startup time, users who run the processes, file permissions, PIDs, and file hashes.
If a suspicious process has not been detected in the last 30 days, its information will be automatically deleted from the process list.
Linux and Windows
Automatic check every hour
Installed Software
Check and manage all software installed on your containers, and identify insecure versions.
You can check real-time and historical software information to determine whether the software is risky.
Real-time software information includes the software name, number of servers, server names, IP addresses, software versions, software update time, and the last scan time.
Historical software change records include the server names, IP addresses, change statuses, software versions, software update time, and the last scan time.
Linux and Windows
Automatic check every day
Auto-startup
Check for auto-startup items and quickly locate Trojans.
Real-time information about auto-started items includes their names, types (auto-started service, startup folder, pre-loaded dynamic library, Run registry key, or scheduled task), number of servers, server names, IP addresses, paths, file hashes, users, and the last scan time.
The historical change records of auto-started items include server names, IP addresses, change statuses, paths, file hashes, users, and the last scan time.
Linux and Windows
Automatic check every hour
Websites
You can check statistics about web directories and sites that can be accessed from the Internet. You can view the directories and permissions, access paths, external ports, certificate information (to be provided later), and key processes of websites.
Linux
Once a week (04:10 a.m. every Monday)
Web Frameworks
You can check statistics about frameworks used for web content presentation, including their versions, paths, and associated processes.
Linux
Once a week (04:10 a.m. every Monday)
Middleware
You can check information about servers, versions, paths, and processes associated with middleware.
Linux and Windows
Once a week (04:10 a.m. every Monday)
Kernel Module
You can check information about all the program module files running in kernels, including associated servers, version numbers, module descriptions, driver file paths, file permissions, and file hashes.
Linux
Once a week (04:10 a.m. every Monday)
Web Services
You can check details about the software used for web content access, including versions, paths, configuration files, and associated processes of all software.
Linux
Once a week (04:10 a.m. every Monday)
Web Applications
You can check details about software used for web content push and release, including versions, paths, configuration files, and associated processes of all software.
Linux and Windows (only Tomcat is supported)
Once a week (04:10 a.m. every Monday)
Databases
You can check details about software that provides data storage, including versions, paths, configuration files, and associated processes of all software.
Linux and Windows (only MySQL is supported)
Once a week (04:10 a.m. every Monday)
Viewing Asset Information of a Single Server
Log in to the management console.
Click in the upper left corner of the page, select a region, and choose Security > HSS. The HSS page is displayed.
In the navigation pane, choose Asset Management > Servers & Quota. Click the Servers tab.
Note
If your servers are managed by enterprise projects, you can select an enterprise project to view or operate the asset and scan information.
Click the name of the target server. On the server details page that is displayed, choose Asset Fingerprints > Servers.
Click a fingerprint in the fingerprint list to view its asset information. For more information, see Table 1.