Use of FunctionGraph
FunctionGraph allows you to run your code without provisioning or managing servers, while ensuring high availability and scalability. All you need to do is upload your code and set execution conditions, and FunctionGraph will take care of the rest.
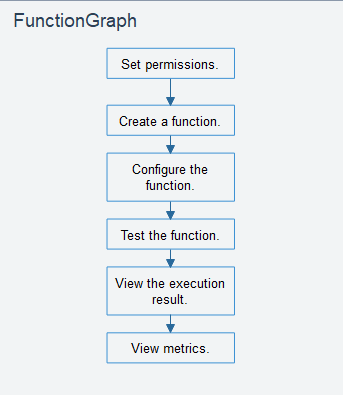
To quickly create a function using FunctionGraph, do as follows:

Set permissions: Ensure that you have the FunctionGraph FullAccess permissions.
Create a function: Create a function from scratch or using the sample code or a container image.
Configure the function: Configure the code source or modify other parameters.
Test the function: Create a test event to debug the function.
View the execution result: On the function details page, view the execution result based on the configured test event.
View metrics: On the Monitoring tab page of the function details page, view function metrics.
Process
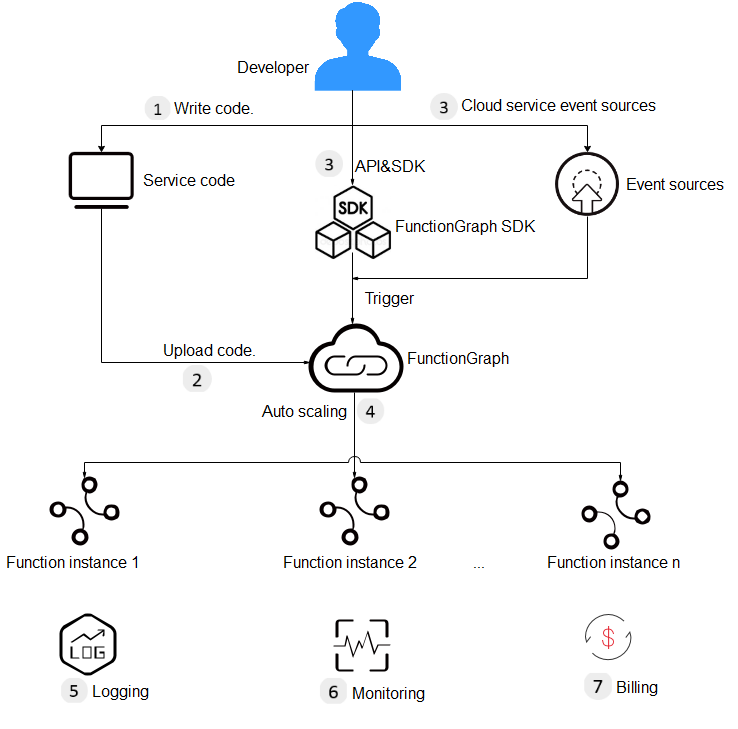
Figure 1 shows the process of using functions.
Write code, package and upload it to FunctionGraph, and add event sources such as Simple Message Notification (SMN) and API Gateway (APIG) event sources to build applications.
Functions are triggered by RESTful API calls or event sources to achieve expected service purposes. During this process, FunctionGraph automatically schedules resources.
View logs and metrics. Note that you will be billed based on code execution duration.

Figure 1 Flowchart
The following shows the details:
Write code.
Write code in Node.js, Python, Java, C#, PHP, or Go.
Upload code.
Edit code inline, upload a local ZIP or JAR file, or upload a ZIP file from OBS. For details, see Creating a Deployment Package.
Trigger functions by API calls or cloud service events.
Functions are triggered by API calls or cloud service events. For details, see Creating Triggers.
Implement auto scaling.
FunctionGraph implements auto scaling based on the number of requests. For details, see section "Notes and Constraints".
View logs.
View run logs of function. FunctionGraph is interconnected with Log Tank Service (LTS). For details, see Logs.
View monitoring information.
View graphical monitoring information. FunctionGraph is interconnected with Cloud Eye. For details, see Metrics.
Introduction to Dashboard
Log in to the FunctionGraph console and choose Dashboard in the navigation pane on the left.
View your created functions/function quota, used storage/storage quota, and monthly invocations and resource usage.

Figure 2 Monthly statistics
View tenant-level metrics, including invocations, errors, duration, and throttles.
Table 1 describes the function metrics.
Table 1 Function metrics¶ Metric
Unit
Description
Invocations
Count
Total number of invocation requests, including invocation errors and throttled invocations. In case of asynchronous invocation, the count starts only when a function is executed in response to a request.
Duration
ms
Maximum duration: the maximum duration all functions are executed at a time within a period.
Minimum duration: the minimum duration all functions are executed at a time within a period.
Average duration: the average duration all functions are executed at a time within a period.
Errors
Count
Number of times that your functions failed with error code 200 being returned. Errors caused by function syntax or execution are also included.
Throttles
Count
Number of times that FunctionGraph throttles your functions due to the resource limit.