Configuring Alarm Rules for Critical Metrics
This section describes the alarm rules of some metrics and how to configure the rules. In actual scenarios, configure alarm rules for metrics by referring to the following alarm policies.
Alarm Policies for DCS Redis Instances
Metric | Normal Range | Alarm Policy | Approach Upper Limit | Handling Suggestion |
|---|---|---|---|---|
CPU Usage | 0-100 | Alarm threshold: 70 Number of consecutive periods: 2 Alarm severity: Major | No | Consider capacity expansion based on the service analysis. The CPU capacity of a single-node or master/standby instance cannot be expanded. If you need larger capacity, use a cluster instance instead. This metric is available only for read/write splitting, Proxy Cluster, single-node, and master/standby instances. For Redis Cluster instances, this metric is available only on the Redis Server level. You can view the metric on the Redis Server tab page on the Performance Monitoring page of the instance. |
Average CPU Usage | 0-100% | Alarm threshold: > 70% Number of consecutive periods: 2 Alarm severity: Major | No | Consider capacity expansion based on the service analysis. The CPU capacity of a single-node or master/standby instance cannot be expanded. If you need larger capacity, use a cluster instance instead. This metric is available only for read/write splitting, single-node, Proxy Cluster, and master/standby instances. For Redis Cluster instances, this metric is available only on the Redis Server level. You can view the metric on the Redis Server tab page on the Performance Monitoring page of the instance. |
Memory Usage | 0-100 | Alarm threshold: 70 Number of consecutive periods: 2 Alarm severity: Major | No | Expand the capacity of the instance. |
Connected Clients | 0-10,000 | Alarm threshold: 8000 Number of consecutive periods: 2 Alarm severity: Major | No | Optimize the connection pool in the service code to prevent the number of connections from exceeding the maximum limit. For single-node and master/standby instances, the maximum number of connections allowed is 10,000. You can adjust the threshold based on service requirements. Configure this alarm policy on the instance level for single-node and master/standby instances. For cluster instances, configure this alarm policy on the Redis Server and Proxy level. |
New Connections (Count/min) | 0-10,000 | Alarm threshold: 10,000 Number of consecutive periods: 2 Alarm severity: Minor |
| Check whether connect is used and whether the client connection is abnormal. Use persistent connections ("pconnect" in Redis terminology) to ensure performance. Configure this alarm policy on the instance level for single-node and master/standby instances. For cluster instances, configure this alarm policy on the Redis Server and Proxy level. |
Alarm Policies for Redis Server Nodes of DCS Redis Instances
Metric | Value Range | Alarm Policy | Approach Upper Limit | Handling Suggestion |
|---|---|---|---|---|
CPU Usage | 0-100% | Alarm threshold: > 70% Number of consecutive periods: 2 Alarm severity: Major | No | Check the service for traffic surge. Check whether the CPU usage is evenly distributed to Redis Server nodes. If the CPU usage is high on multiple nodes, consider capacity expansion. Expanding the capacity of a cluster instance will scale out nodes to share the CPU pressure. If the CPU usage is high on a single node, check whether hot keys exist. If yes, optimize the service code to eliminate hot keys. |
Average CPU Usage | 0-100% | Alarm threshold: > 70% Number of consecutive periods: 2 Alarm severity: Major | No | Consider capacity expansion based on the service analysis. The CPU capacity of a single-node, read/write splitting, or master/standby instance cannot be expanded. If you need larger capacity, use a cluster instance instead. |
Memory Usage | 0-100% | Alarm threshold: > 70% Number of consecutive periods: 2 Alarm severity: Major | No | Check the service for traffic surge. Check whether the memory usage is evenly distributed to Redis Server nodes. If the memory usage is high on multiple nodes, consider capacity expansion. If the memory usage is high on a single node, check whether big keys exist. If yes, optimize the service code to eliminate big keys. |
Connected Clients | 0-10,000 | Alarm threshold: > 8000 Number of consecutive periods: 2 Alarm severity: Major | No | Check whether the number of connections is within the appropriate range. If yes, adjust the alarm threshold. |
New Connections | >= 0 | Alarm threshold: > 10,000 Number of consecutive periods: 2 Alarm severity: Minor |
| Check whether connect is used. To ensure performance, use persistent connections ("pconnect" in Redis terminology). |
Slow Query Logs | 0-1 | Alarm threshold: > 0 Number of consecutive periods: 1 Alarm severity: Major |
| Use the slow query function on the console to analyze slow commands. |
Bandwidth Usage | 0-200% | Alarm threshold: > 90% Number of consecutive periods: 2 Alarm severity: Major | Yes | Check whether the bandwidth usage increase comes from read services or write services based on the input and output flow. If the bandwidth usage of a single node is high, check whether big keys exist. Even if the bandwidth usage exceeds 100%, flow control may not necessarily be performed. The actual flow control is subject to the Flow Control Times metric. Even if the bandwidth usage is below 100%, flow control may be performed. The real-time bandwidth usage is reported once in every reporting period. The flow control times metric is reported every second. During a reporting period, the traffic may surge within seconds and then fall back. By the time the bandwidth usage is reported, it has restored to the normal level. |
Flow Control Times | >= 0 | Alarm threshold: > 0 Number of consecutive periods: 1 Alarm severity: Critical | Yes | Consider capacity expansion based on the specification limits, input flow, and output flow. Note This metric is supported only by Redis 4.0 and later and not by Redis 3.0. |
Alarm Policies for Proxy Nodes of DCS Redis Instances
Metric | Value Range | Alarm Policy | Approach Upper Limit | Handling Suggestion |
|---|---|---|---|---|
CPU Usage | 0-100% | Alarm threshold: > 70% Number of consecutive periods: 2 Alarm severity: Critical | Yes | Consider capacity expansion, which will add proxies. |
Memory Usage | 0-100% | Alarm threshold: > 70% Number of consecutive periods: 2 Alarm severity: Critical | Yes | Consider capacity expansion, which will add proxies. |
Connected Clients | 0-30,000 | Alarm threshold: > 20,000 Number of consecutive periods: 2 Alarm severity: Major | No | Optimize the connection pool in the service code to prevent the number of connections from exceeding the maximum limit. |
Procedure
In the following example, an alarm rule is set for the CPU Usage metric.
Log in to the DCS console.
Click
 in the upper left corner and select a region and a project.
In the navigation pane, choose Cache Manager.
In the same row as the DCS instance whose metrics you want to view, choose More > View Metric.

Figure 1 Viewing instance metrics
Locate the CPU Usage metric. Hover over the metric and click
 to create an alarm rule for the metric.
The Create Alarm Rule page is displayed.
Specify the alarm rule details.
Specify the alarm policy and alarm severity.
For example, the alarm policy shown in the following figure indicates that an alarm will be triggered if the CPU usage exceeds the threshold for two consecutive periods.
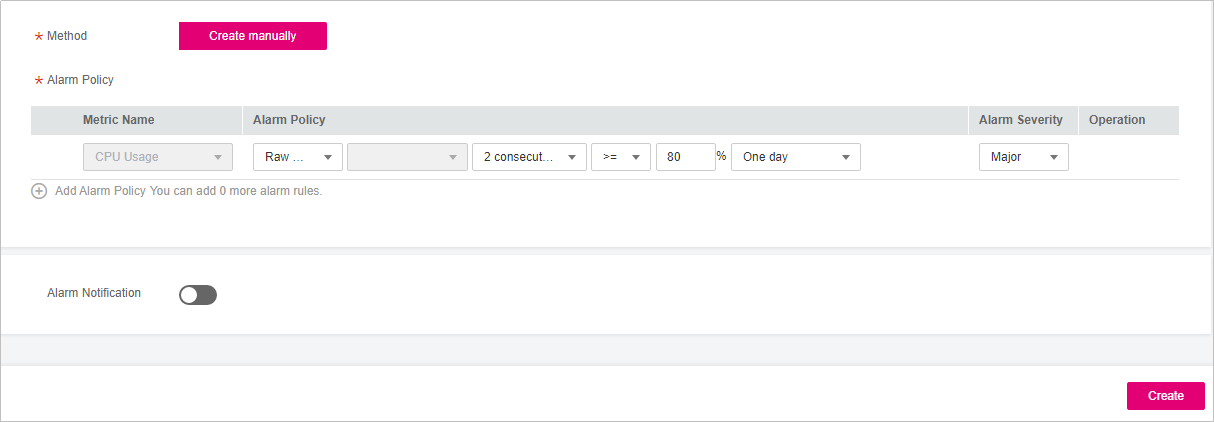
Figure 2 Setting the alarm content
Set the alarm notification configurations. If you enable Alarm Notification, set the validity period, notification object, and trigger condition.
Click Create.
Note
For more information about creating alarm rules, see the Cloud Eye User Guide > Using the Alarm Function > Creating Alarm Rules.
For details about how to modify or disable the created alarms, see "Using the Alarm Function" > "Alarm Rule Management" in the Cloud Eye User Guide.