Viewing CTS Traces
Log in to the management console.
Click
 in the upper left corner and select the desired region and project.
Click Service List and select Cloud Trace Service under Management & Deployment.
Choose Trace List in the navigation pane on the left.
Use filters to query traces. The following four filters are available:
Trace Type, Trace Source, Resource Type, and Search By
Select a filter from the drop-down list.
When you select Resource ID for Search By, you also need to select or enter a resource ID.
Operator: Select a specific operator (at user level rather than tenant level).
Trace Status: Available options include All trace statuses, normal, warning, and incident. You can only select one of them.
Time range: In the upper right corner of the page, you can query traces in the last one hour, last one day, last one week, or within a customized period.
Click
 on the left of the record to be queried to extend its details.
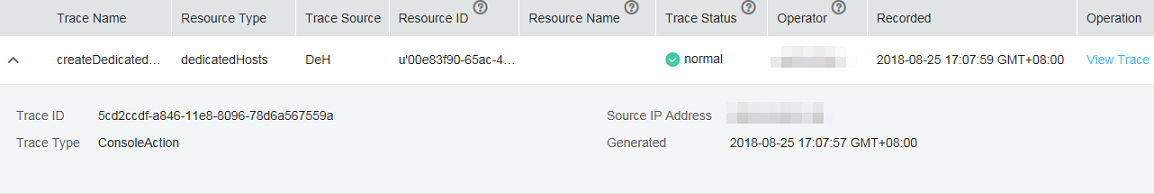
Figure 1 Trace details
Locate a trace and click View Trace in the Operation column.
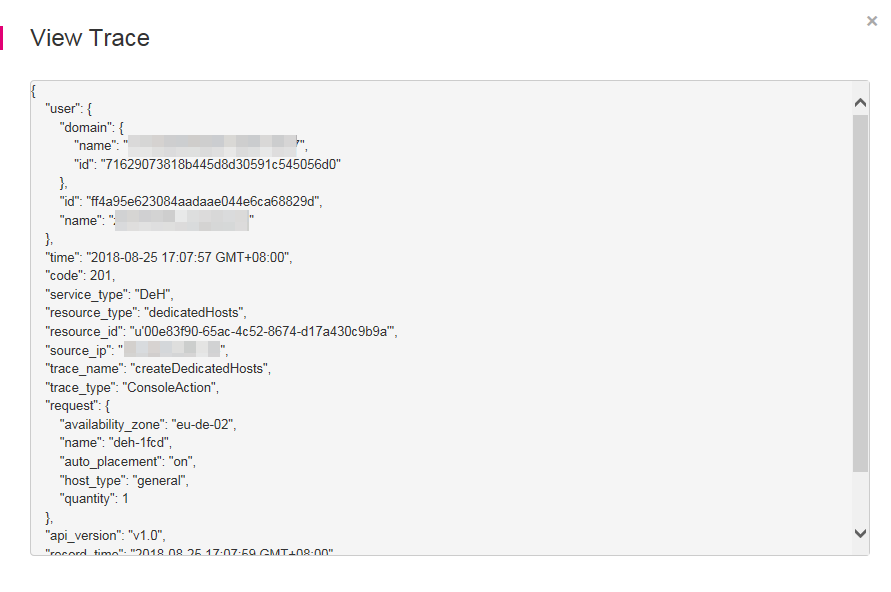
Figure 2 View Trace
For details about the key fields in the CTS trace structure, see the Cloud Trace Service User Guide.