Viewing the Alarms
This section describes how to view and confirm alarms of database audit.
Prerequisites
You have applied for a database audit instance and the Status is Running.
Database audit has been enabled.
You have configured alarm notifications.
Procedure
Log in to the management console.
Click the name of an instance, click the Alarm Monitoring tab.
View the alarm information, as shown in Figure 1. For details about related parameters, see Table 1.
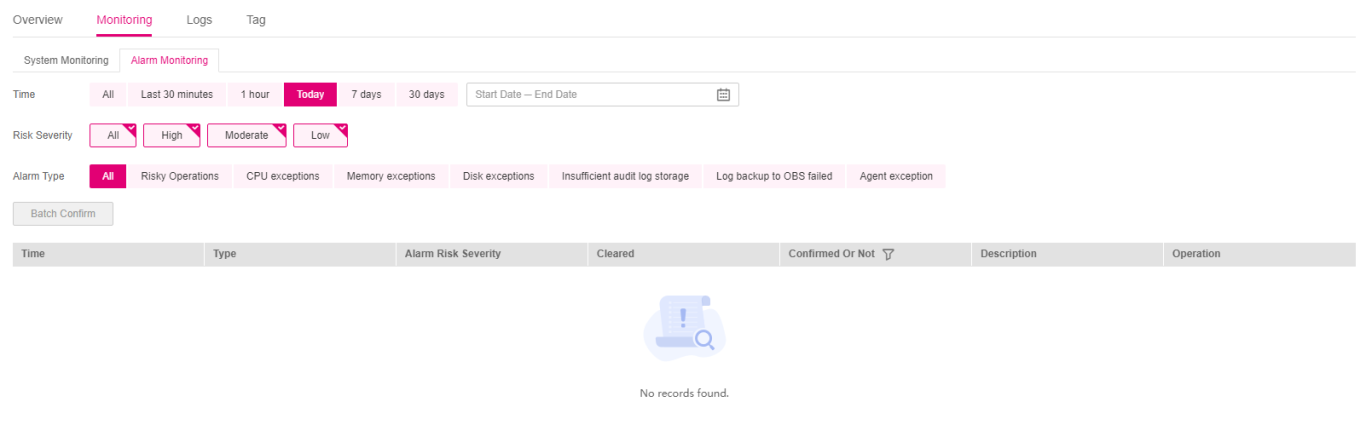
Figure 1 Viewing the alarms
Table 1 Parameters of alarms¶ Parameter
Description
Time
Time when an alarm occurred.
Type
Alarm type. The options are as follows:
Audit traffic exceeds threshold
CPU exceptions
Memory exceptions
Disk exceptions
Insufficient audit log storage
Log backup to OBS failed
Agent exceptions
Alarm Risk Severity
Risk severity of an alarm. The options are as follows:
High
Moderate
Low
Cleared
Time when an alarm is cleared
Confirmed Or Not
Confirmation status of an alarm.
Description
Description of an alarm
Follow-Up Procedure
Note
You can select multiple alarms to be confirmed and click Batch Confirm to batch confirm alarms.