Viewing the Audit Dashboard
After connecting the database to the database audit instance, view the audit statistics, including the overall audit statistics, risk distribution, session statistics, and SQL distribution.
Prerequisites
You have applied for a database audit instance and the Status is Running.
Database audit has been enabled.
Procedure
Log in to the management console.
Select a region, click
 , and choose Security > Database Security Service. The Dashboard page is displayed.
In the navigation tree on the left, choose Data Reports. The Data Reports page is displayed.
In the Instance drop-down list, select the instance whose audit information you want to view.
View the overall audit statistics, risk distribution, session statistics, and SQL distribution.
Select All databases or a specified database from the Database drop-down list to view the statistics about all databases in the instance or a specified database.
Select Last 30 minutes, 1 hour, Today, 7 days, or 30 days, or click
 to customize start time and end time to view the statistics of the specified time range.
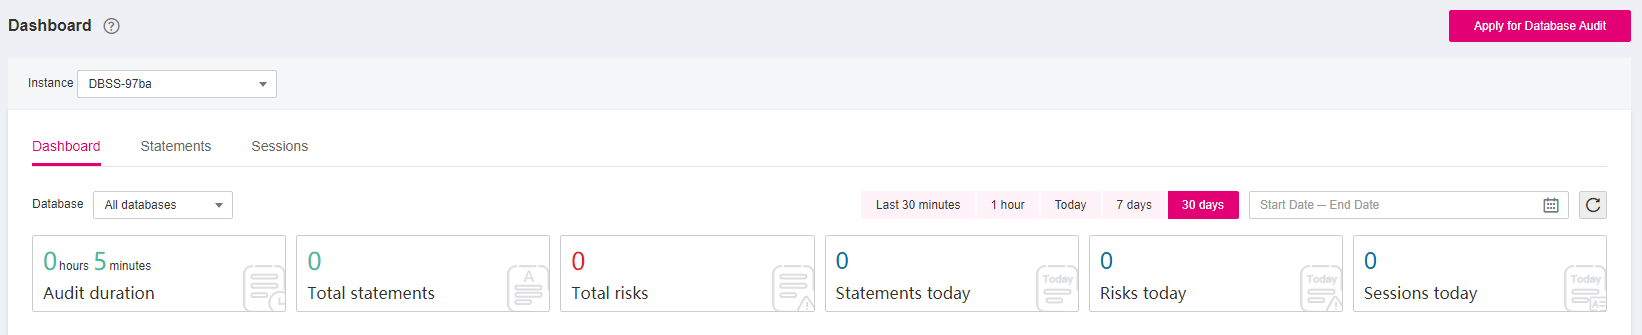
Figure 1 Viewing the audit statistics
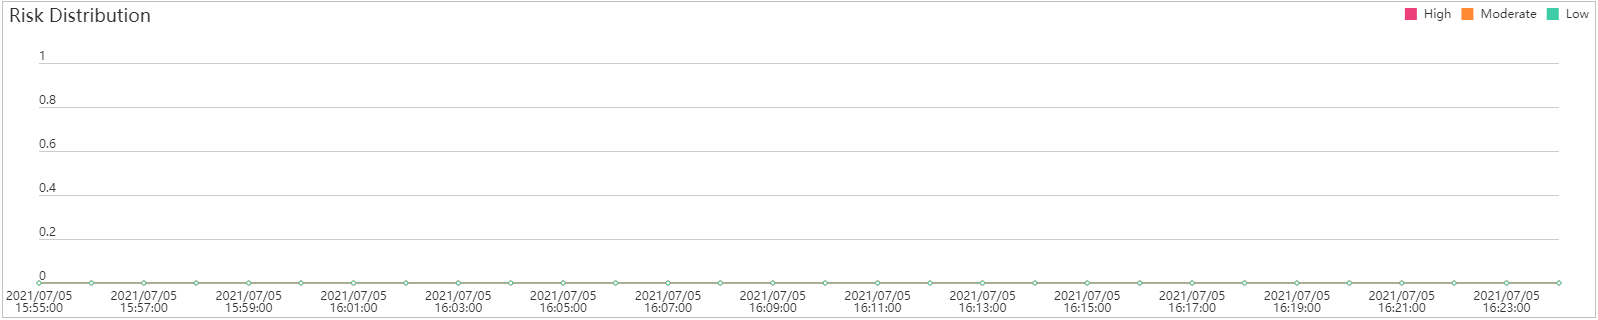
Figure 2 Risk distribution
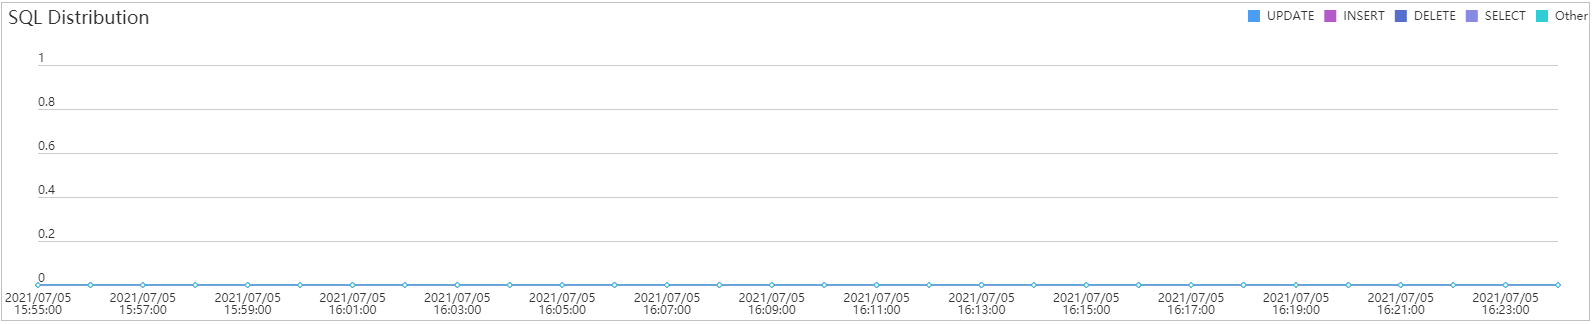
Figure 3 Session statistics