Real-Time Queries
Going to the Real-time Query Page
Log in to the GaussDB(DWS) console.
On the Clusters > Dedicated Clusters page, locate the cluster to be monitored.
In the Operation column of the target cluster, click Monitoring Panel.
In the navigation pane, choose Monitoring > Queries.
You can check the real-time information about all queries and sessions running in the cluster.
Important
Real-time query is supported only in clusters of version 8.1.2 and later.
To enable real-time query monitoring, choose Settings > Monitoring, click Monitoring Collection, and enable Real-Time Query Monitoring. For details, see Monitoring Collection. Enabling real-time query may cause a large amount of data. Exercise caution when performing this operation.
Prerequisites
You need to set GUC parameters before viewing data on the monitoring page. If GUC parameters are not set, real-time or historical query may be unavailable. However, if this parameter is set, the cluster performance may deteriorate. Therefore, you need to balance the settings of related parameters. The following table describes recommended settings. For how to modify parameters, see "Modifying Database Parameters". Setting GUC Parameters provides parameter details.
GUC Parameter | CN Configuration | DN Configuration |
|---|---|---|
max_active_statements | 10 | 10 |
enable_resource_track | on | on |
resource_track_level | query | query |
resource_track_cost | 0 | 0 |
resource_track_duration | 10 | 10 |
enable_resource_record | on | on |
session_statistics_memory | 1000MB | 1000MB |
Querying Information
You can view the queries statistics, the number of sessions, average session duration (time of all session connections divided by the number of sessions), number of queries, average query duration, and average query waiting time.

Checking Live Sessions
On the Sessions tab, you can browse the real-time information about all running queries,
Session ID
Username
Session duration
Application name
QueryBand
Client IP address
Connected CN
Session status. It can be:
idle: The backend is waiting for new client commands.
active: The backend is executing queries.
idle in transaction: The backend is in a transaction, but there is no statement being executed in the transaction.
idle in transaction (aborted): The backend is in a transaction, but there are statements failed in the transaction.
fastpath function call: The backend is executing a fast-path function.
Start time
Lock mode
Lock holding status
Locked object
Query SQL
Lock wait
Current query duration
Current query start time
Note
You can click a session ID to view the queries in the current session. For details, see Viewing Historical Query Monitoring Details.
To terminate a session, select the session, click Terminate a Session, and confirm your operation.
If you want to terminate all idle sessions, click Clear Idle Sessions.
The fine-grained permission control function is added. Only users with the operate permission are able to terminate sessions. For users with the read-only permission, the Terminate a Session button is grayed out.
Checking Real-time Queries
On the Queries tab, you can browse all the queries that are running in a specified time period, including:
Query ID
Username
Application name
Database name
Resource pool
Submission time
Blocking time (ms)
Execution time (ms)
Statement
Connected CN
Client IP address
Lane
Query status. It can be:
idle: The backend is waiting for new client commands.
active: The backend is executing queries.
idle in transaction: The backend is in a transaction, but there is no statement being executed in the transaction.
idle in transaction (aborted): The backend is in a transaction, but there are statements failed in the transaction.
fastpath function call: The backend is executing a fast-path function.
Session ID
Statement status
Note
You can click a query ID to view the monitoring details. However, details cannot be displayed for queries whose ID is 0. Query 0 indicates that an exception occurs during the query.
To terminate a query, select the query, click Terminate Query, and confirm your operation.
The fine-grained permission control function is added. Only users with the operate permission are able to terminate queries. For users with the read-only permission, the Terminate Query button is grayed out.
The fast and slow lanes are selected based on the cost in the execution plan. If the optimizer estimates that the memory usage of a statement is greater than 32 MB, the statement enters the slow lane. Otherwise, the statement enters the fast lane.
Viewing Real-time Query Monitoring Details
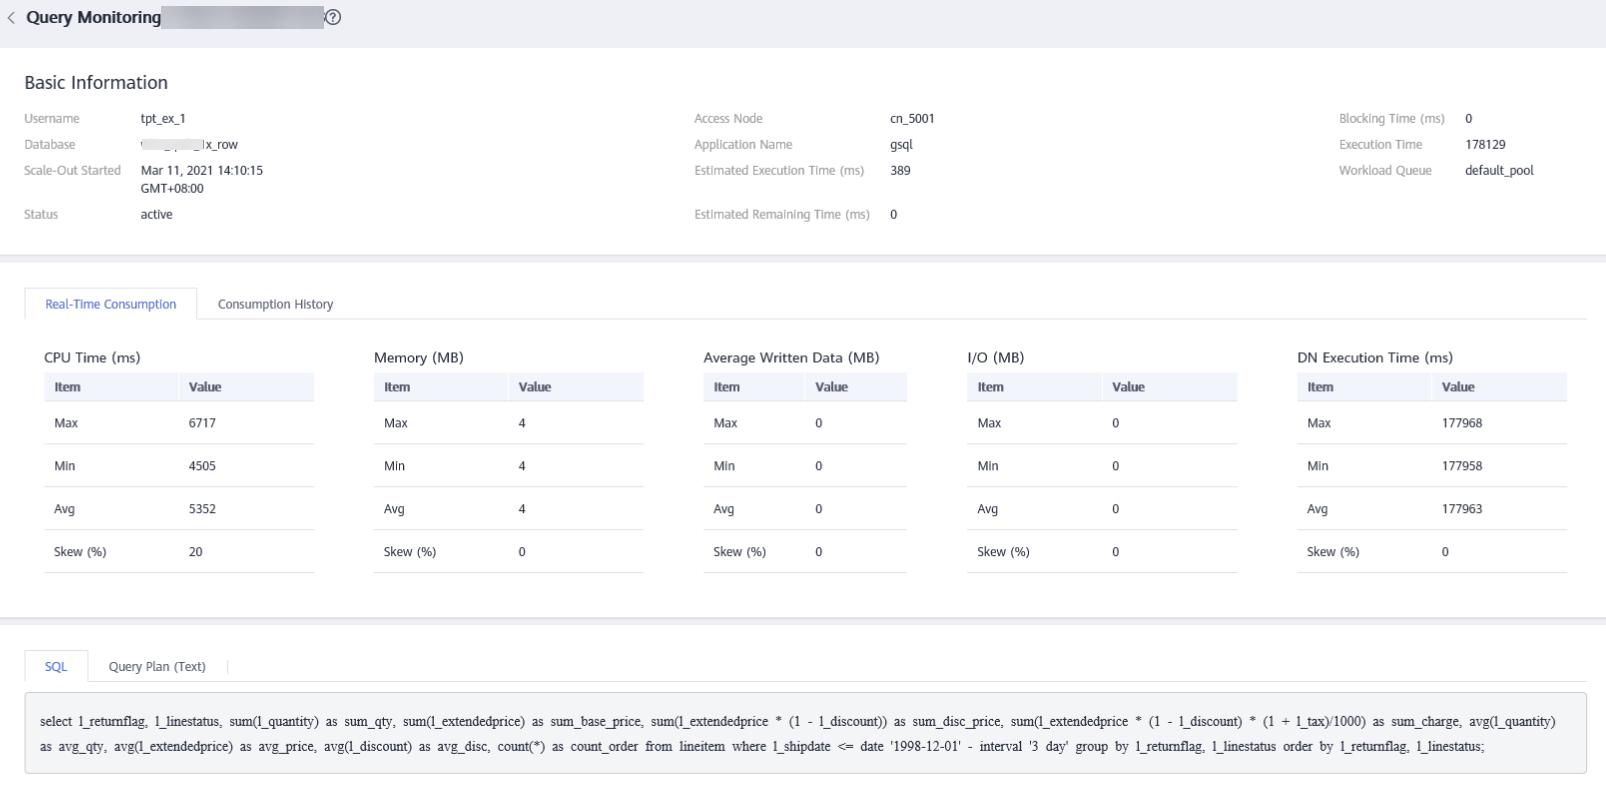
You can click a query ID to view the query details, including the basic information of query statements, real-time and historical resource consumption, SQL description, and query plan.
