Workload Snapshots
You can check the basic information about the cluster workload snapshots, manually create a snapshot, and configure snapshot parameters.
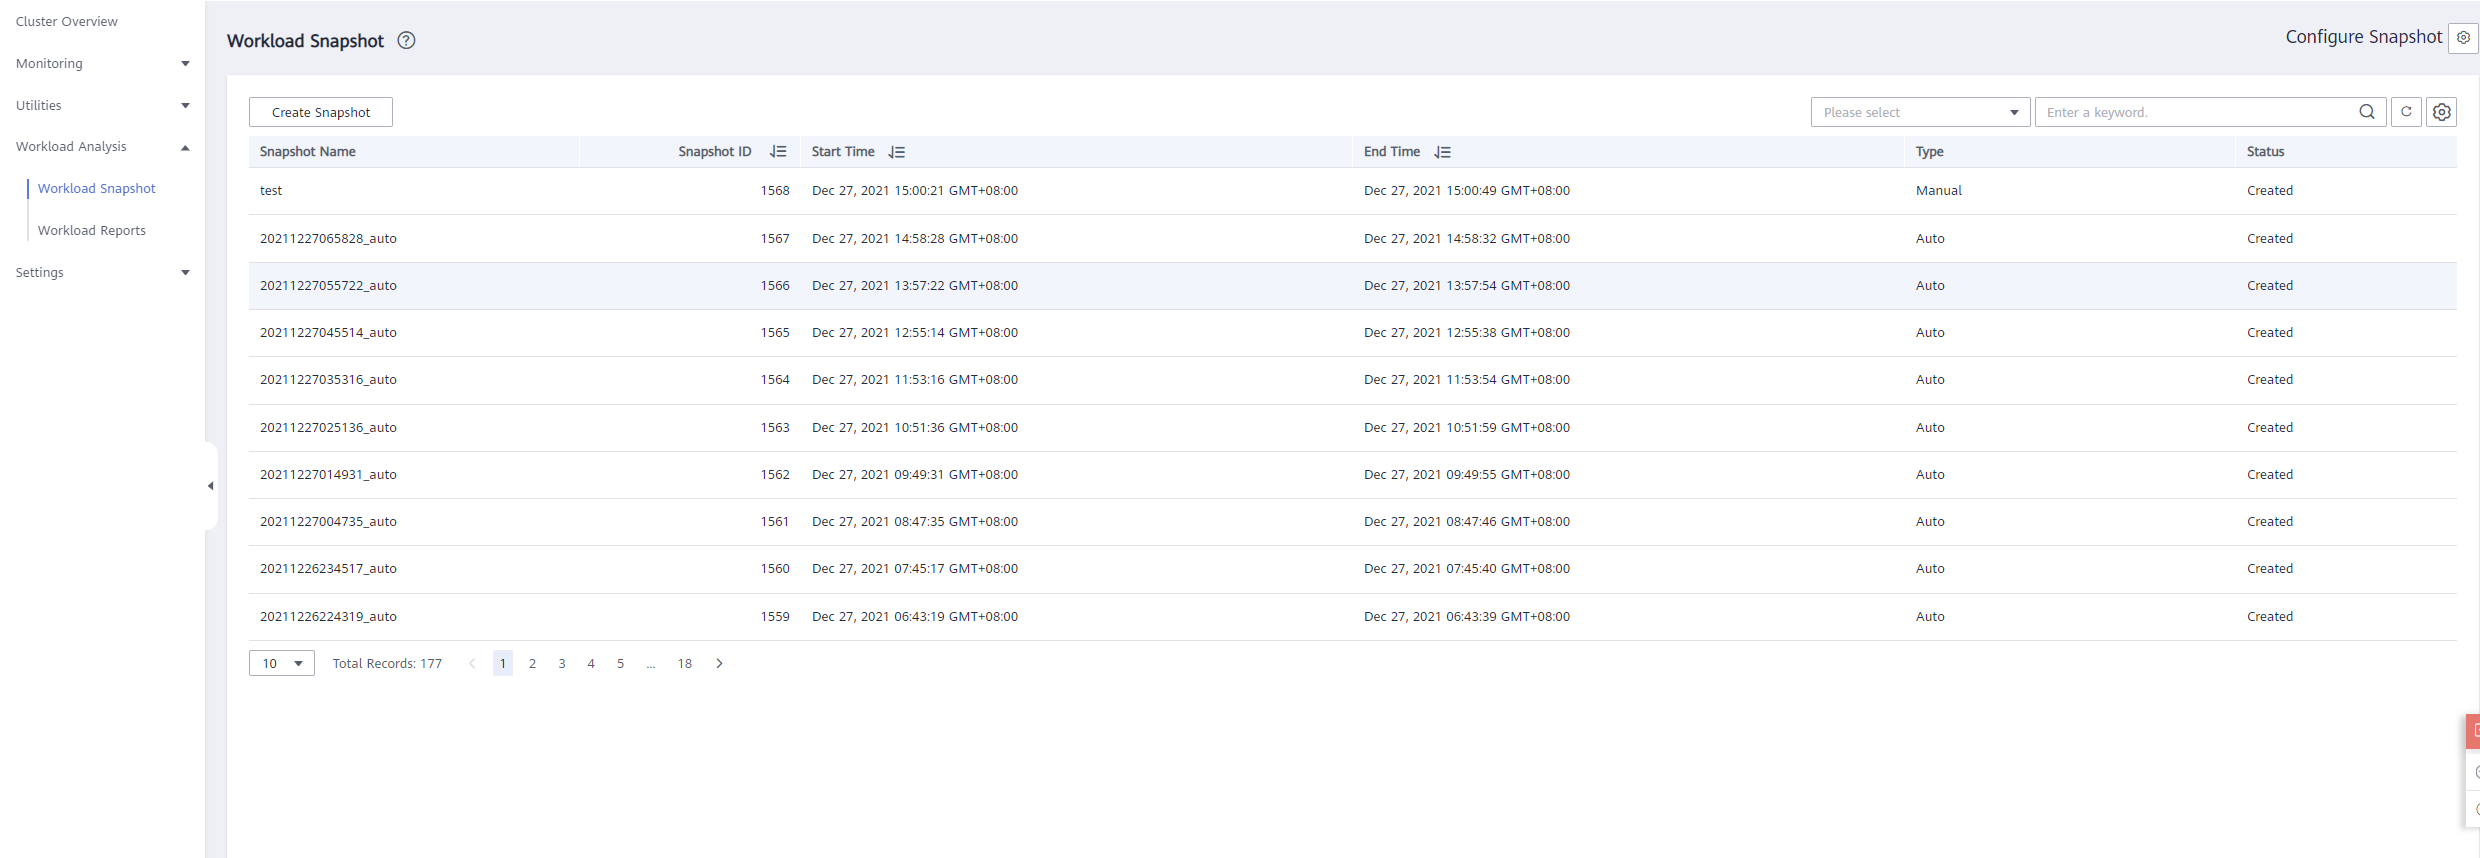
Checking Workload Snapshots
Log in to the GaussDB(DWS) management console.
On the Clusters page, locate the target cluster.
In the Operation column of the cluster, choose Monitoring Panel. The database monitoring page is displayed.
In the navigation pane, choose Workload Analysis > Workload Snapshot. Workload snapshots will be displayed.
Creating a Workload Snapshot
Log in to the GaussDB(DWS) management console.
On the Clusters page, locate the target cluster.
In the Operation column of the cluster, choose Monitoring Panel. The database monitoring page is displayed.
In the navigation pane, choose Workload Analysis > Workload Snapshot. Workload snapshots will be displayed.
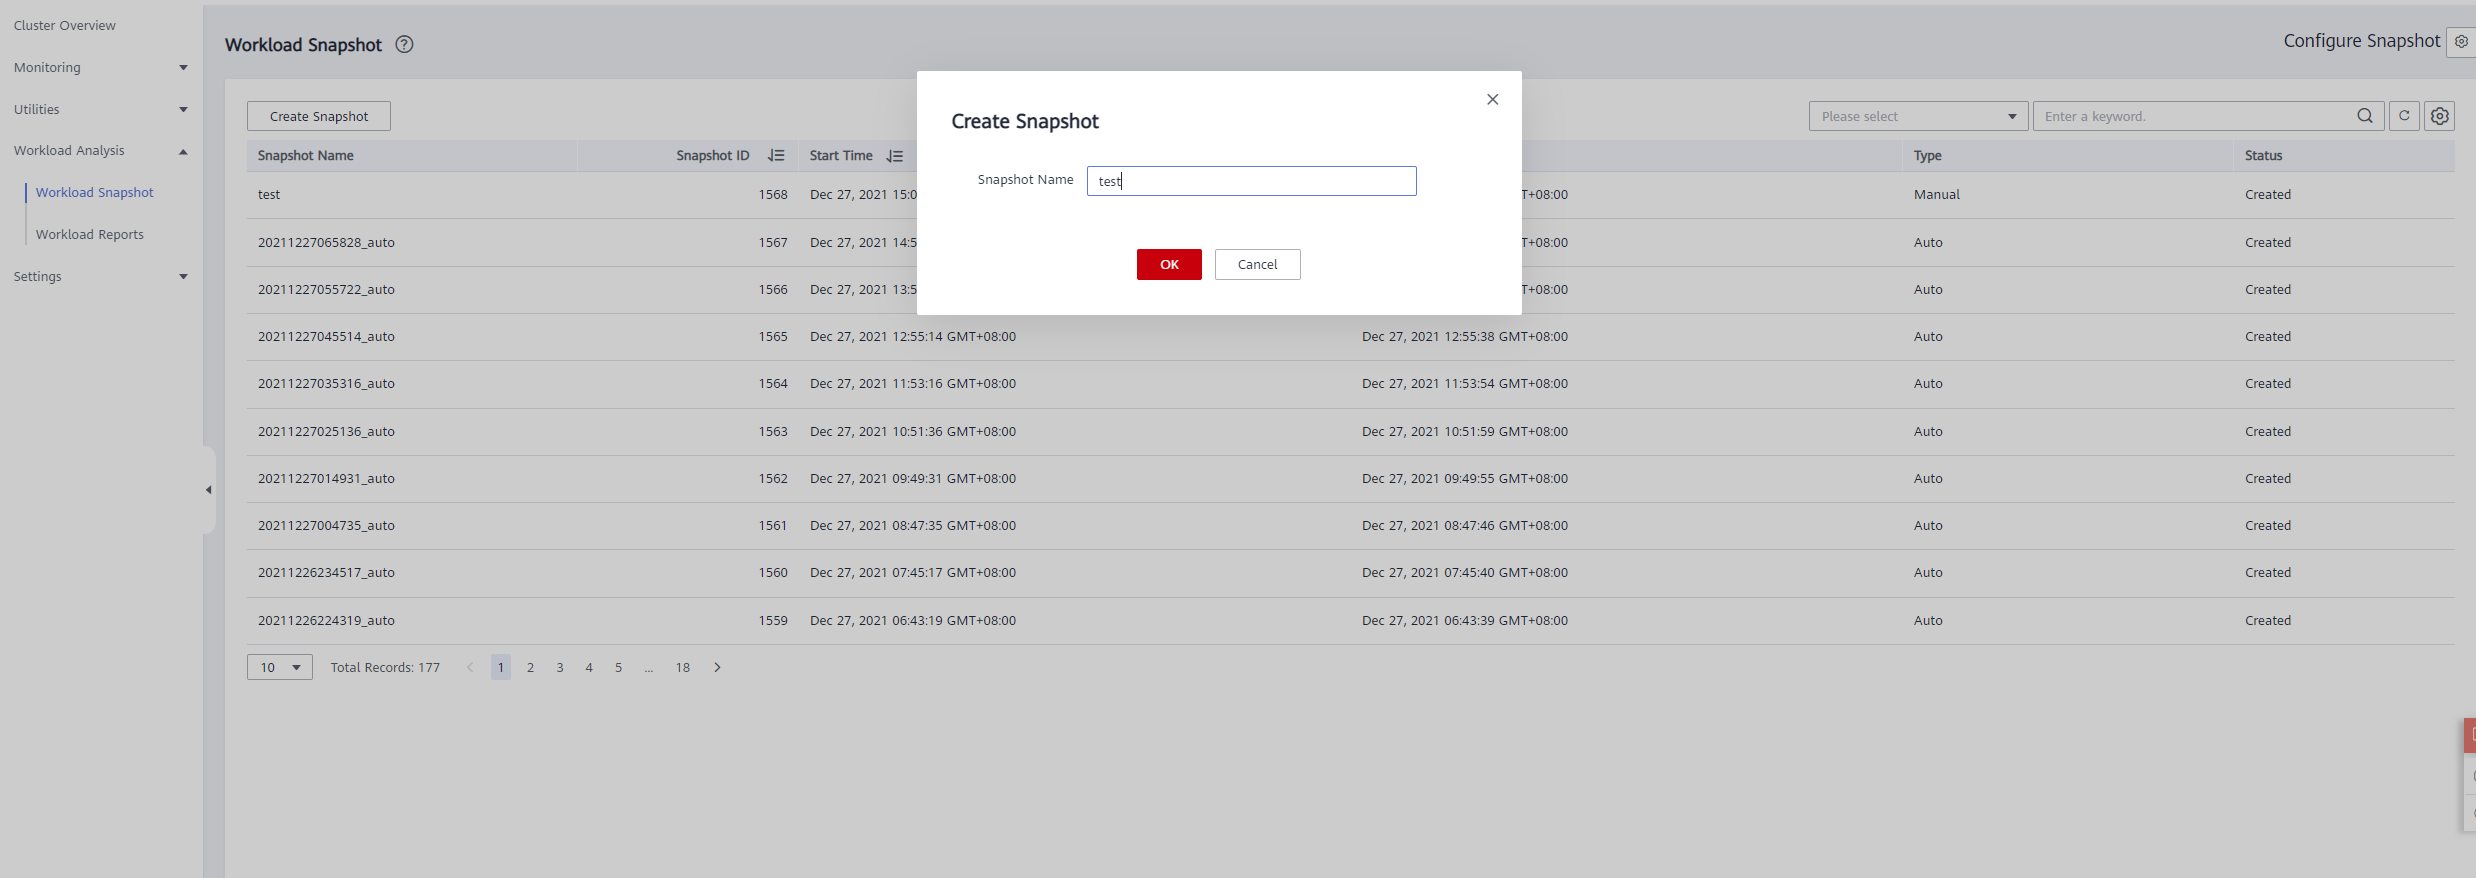
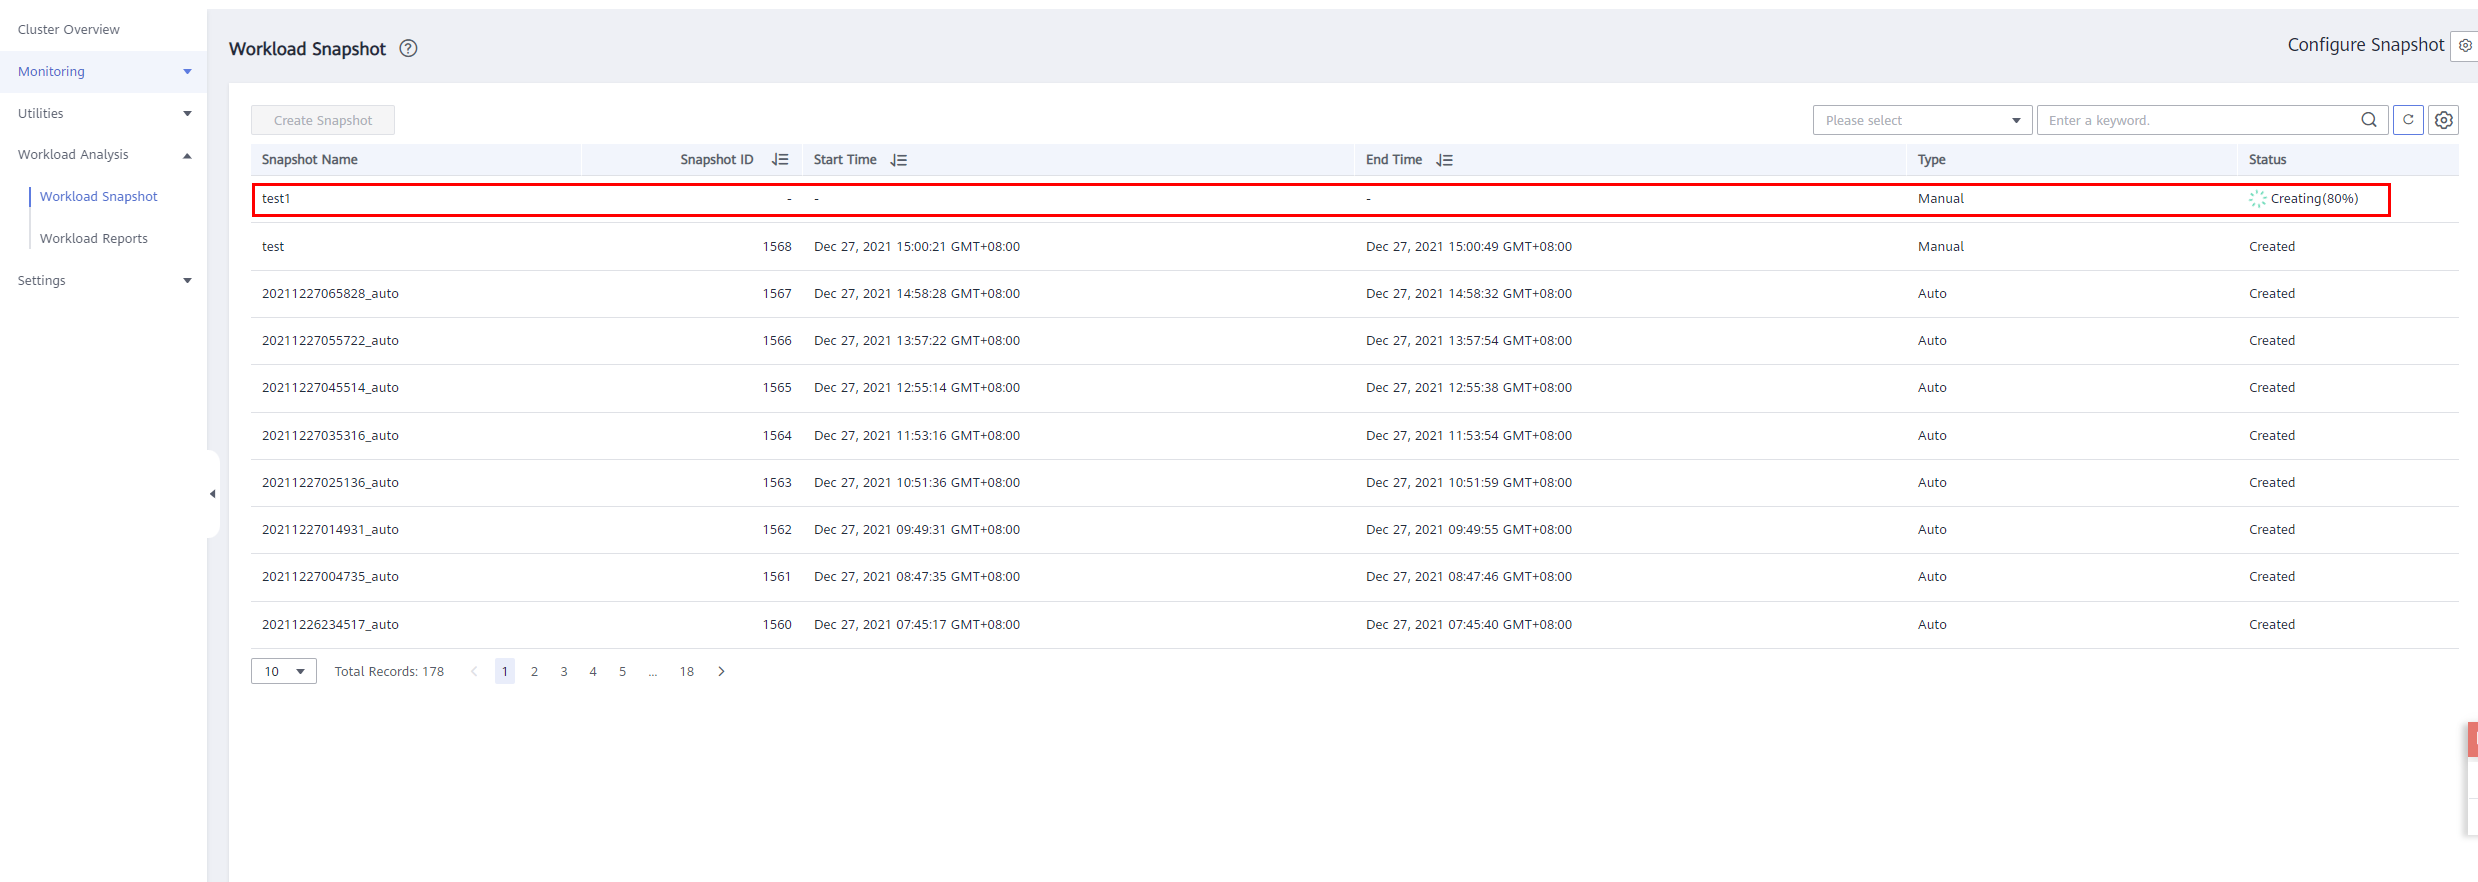
Click Create Snapshot. Enter a snapshot name and click OK.
Note
Before creating a workload snapshot, ensure that the performance view snapshot parameter is enabled. For details, see Configuring Workload Snapshot Parameters.
Configuring Workload Snapshot Parameters
Log in to the GaussDB(DWS) management console.
On the Clusters page, locate the target cluster.
In the Operation column of the cluster, choose Monitoring Panel. The database monitoring page is displayed.
In the navigation pane, choose Workload Analysis > Workload Snapshot. Workload snapshots will be displayed.
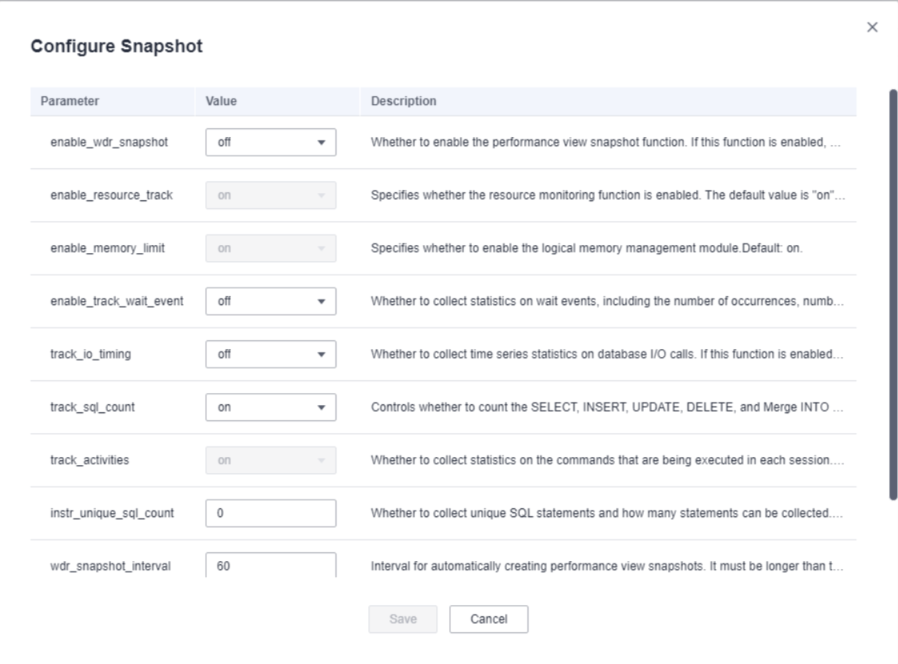
Click Configure Snapshot in the upper right corner. In the dialog box that is displayed, check or modify GUC parameters. For details, see Table 1.
Name | Default Value | Description |
|---|---|---|
Performance view snapshot (enable_wdr_snapshot) | off | Whether to enable the performance view snapshot function. If this function is enabled, GaussDB(DWS) will periodically create snapshots for certain system performance views and save them to disk. You can also manually create snapshots. |
Resource monitoring (enable_resource_track) | on | Whether to enable the resource monitoring function. Resource statistics parameters are valid only if this parameter is enabled. |
Logical memory management module (enable_memory_limit) | on | Whether to enable the logical memory management module. |
Wait event statistics (enable_track_wait_event) | off | Whether to collect statistics on wait events, including the number of occurrences, number of failures, duration, maximum waiting time, minimum waiting time, and average waiting time. |
I/O call time series statistics (track_io_timing) | off | Whether to collect time series statistics on database I/O calls. If this function is enabled, the collector will periodically query the OS time, which may cause heavy overhead on certain platforms. |
SQL count (track_sql_count) | The default value is off for versions earlier than 8.1.3 and on for 8.1.3 and later versions. | Whether to collect statistics on the number of the SELECT, INSERT, UPDATE, DELETE, and MERGE INTO statements that are being executed in each session, the response time of the SELECT, INSERT, UPDATE, and DELETE statements, and the number of DDL, DML, and DCL statements. This parameter takes effect only if track_activities is set to on. |
Session command statistics (track_activities) | on | Whether to collect statistics on the commands that are being executed in each session. |
Unique SQL statistics (instr_unique_sql_count) | 0 | Whether to collect unique SQL statements and how many statements can be collected. |
Snapshot creation interval (wdr_snapshot_interval) | 60 | Interval for automatically creating performance view snapshots. It must be longer than the time needed to create a snapshot. The unit is minute. |
Maximum snapshot retention period (wdr_snapshot_retention_days) | 8 | Maximum retention period of performance snapshots. A large value will require a lot of disk space. The unit is day. |