SQL Probes
You can upload and verify SQL probes, execute probe tasks in one click, and periodically execute probe tasks. Alarms can be reported for timeout SQL probes. The following functions are supported:
Note
The SQL probe is supported only in 8.1.1.300 and later versions. To use it in earlier versions, contact technical support.
Only SELECT statements can be used as SQL probes.
Up to 20 SQL probes can be configured.
To create an SQL probe, you must have the GaussDB(DWS) FullAccess permission.
To enable the SQL probe function, choose Monitoring Settings > Monitoring Collection and enable the SQL Probe metric. For details, see . The default collection frequency is 30s.
Adding a SQL Probe
Log in to the GaussDB(DWS) console.
On the Clusters > Dedicated Clusters page, locate the cluster to be monitored.
In the Operation column of the target cluster, click Monitoring Panel.
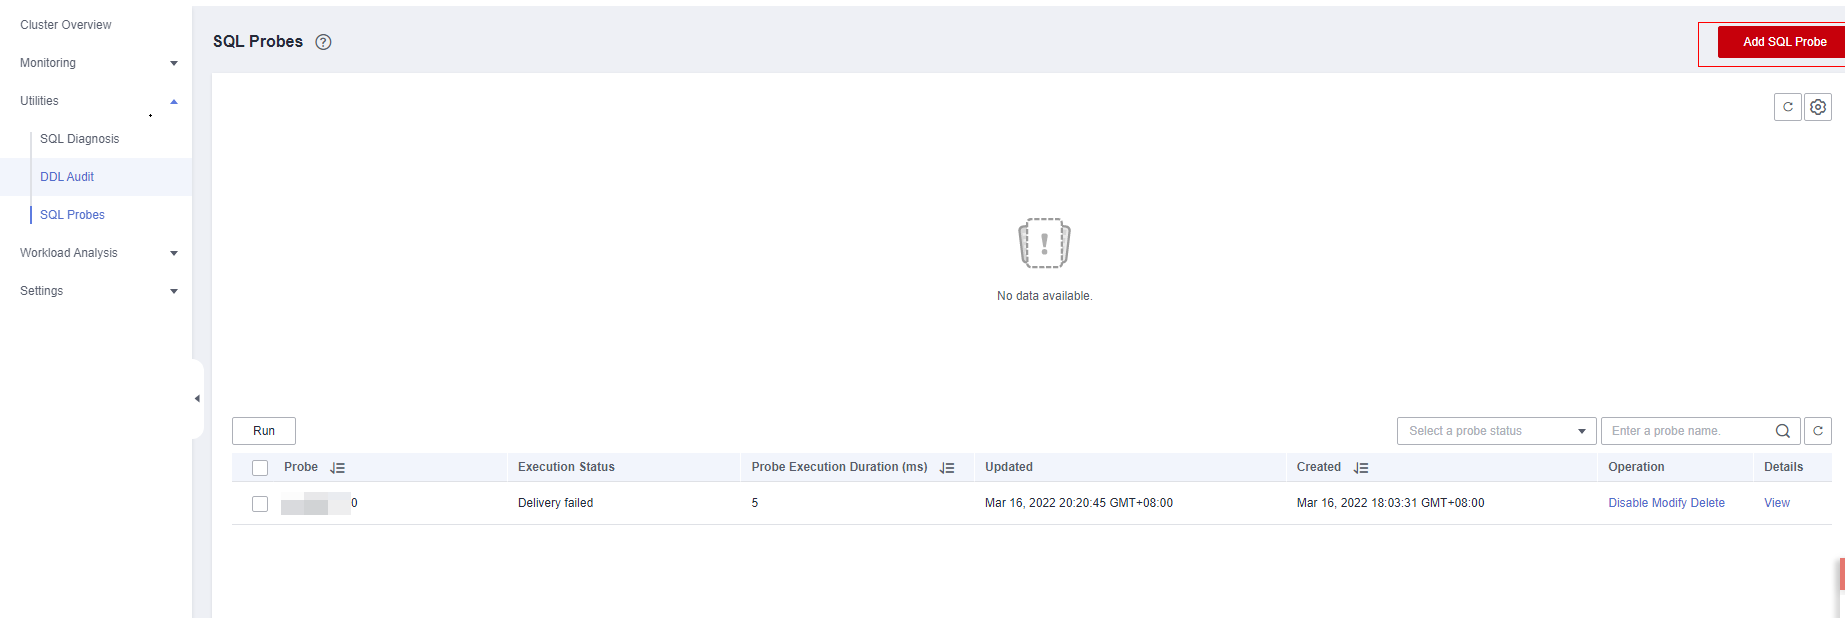
In the navigation pane, choose Utilities > SQL Probes. Click Add SQL Probe.

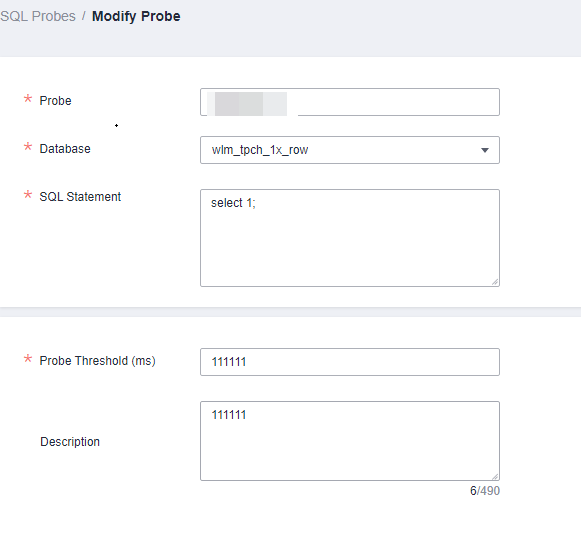
Configure SQL probe parameters.
Probe Name: Name of a probe.
Database: Database where the probe SQL statement is to be executed.
SQL Statement: Probe SQL statement to be executed. (Only SELECT statements are allowed).
Probe Threshold (ms): Timeout threshold of probe SQL execution.
Description: Probe SQL statement description.

Confirm the SQL probe information and click Confirm.
Enabling or Disabling a SQL Probe
Log in to the GaussDB(DWS) console.
On the Clusters > Dedicated Clusters page, locate the cluster to be monitored.
In the Operation column of the cluster, choose Monitoring Panel. The database monitoring page is displayed.
In the navigation pane on the left, choose Utilities > SQL Probes.
In the probe list, click Enable (or Disable) in the Operation column of a probe.

Confirm the information and click OK.
Modifying an SQL Probe
Log in to the GaussDB(DWS) console.
On the Clusters > Dedicated Clusters page, locate the cluster to be monitored.
In the Operation column of the cluster, choose Monitoring Panel. The database monitoring page is displayed.
In the navigation pane on the left, choose Utilities > SQL Probes.
In the probe list, click Modify in the Operation column of a probe.

On the Modify Probe page, modify the SQL probe parameters as required and click OK.

Deleting a SQL Probe
Log in to the GaussDB(DWS) console.
On the Clusters > Dedicated Clusters page, locate the cluster to be monitored.
In the Operation column of the cluster, choose Monitoring Panel. The database monitoring page is displayed.
In the navigation pane on the left, choose Utilities > SQL Probes.
In the probe list, click Delete in the Operation column of a probe.

Confirm the information and click OK.
Executing a SQL Probe in One Click
Log in to the GaussDB(DWS) console.
On the Clusters > Dedicated Clusters page, locate the cluster to be monitored.
In the Operation column of the cluster, choose Monitoring Panel. The database monitoring page is displayed.
In the navigation pane on the left, choose Utilities > SQL Probes.
In the probe list, select a probe and click Run. The system will execute the selected probe and update information about the probe.
Confirm the information and click OK.