SQL Diagnosis
Prerequisites
To enable SQL diagnosis, enable monitoring on real-time and historical queries on the Queries and History tabs, respectively. For details, see Monitoring Collection.
Viewing SQL Diagnosis
Log in to the GaussDB(DWS) management console.
On the Clusters > Dedicated Clusters page, locate the cluster to be monitored.
In the Operation column of the target cluster, click Monitoring Panel.
In the navigation pane on the left, choose Utilities > SQL Diagnosis. The metrics include:
Query ID
Database
Schema Name
User Name
Client
Client IP Address
Running Time (ms)
CPU Time (ms)
Scale-Out Started
Completed
Details
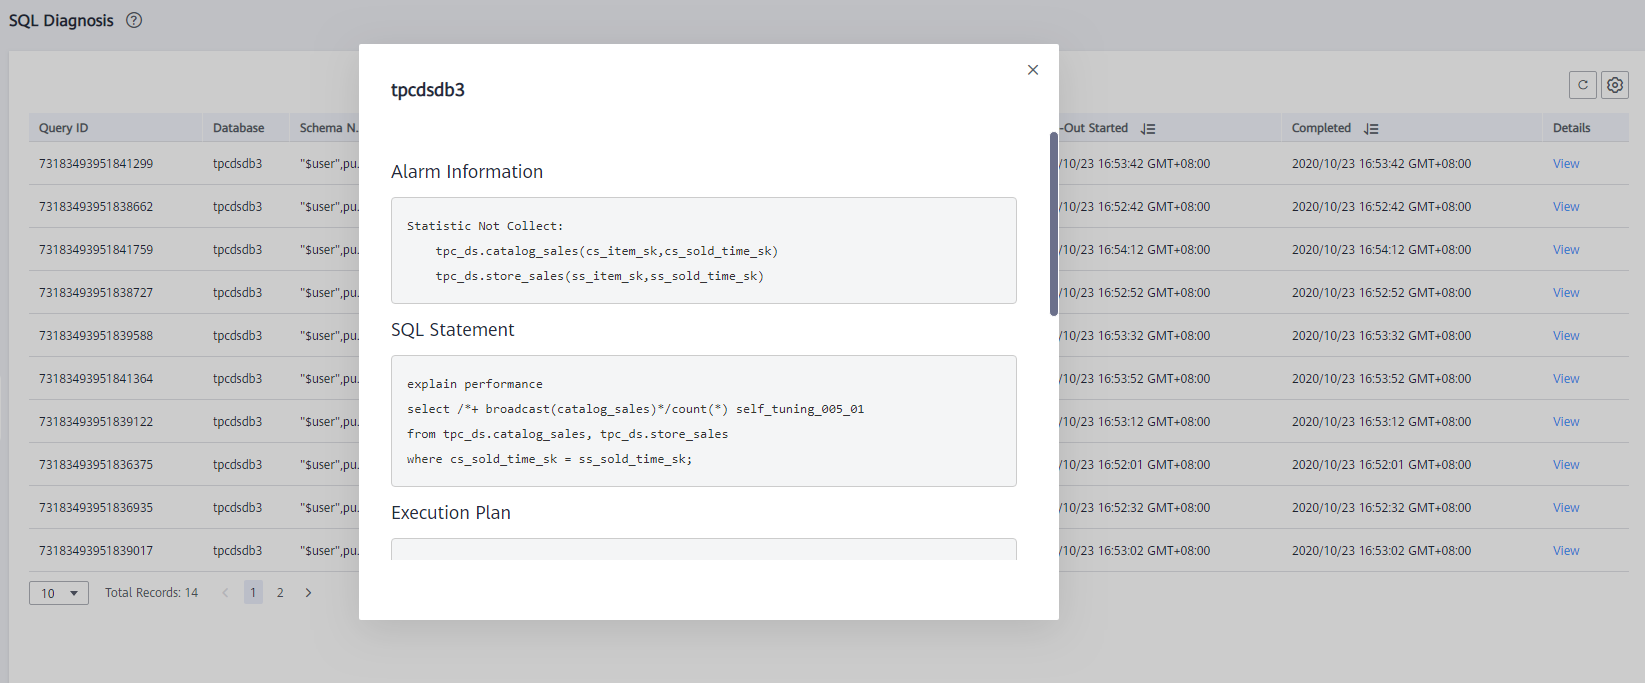
On the SQL Diagnosis page, you can view the SQL diagnosis information. In the Details column of a specified query ID, click View to view the detailed SQL diagnosis result, including:
Diagnosis Type
Alarm Information
SQL Statement
Execution Plan

Setting GUC Parameters
GUC parameters related to SQL diagnosis are as follows. For details, see "GUC Parameters" in the Data Warehouse Service (DWS) Developer Guide.
enable_resource_track
Value range: boolean
Default value: on
Expected DMS value: on (for reference only)
Function: Specifies whether to enable the real-time resource monitoring function.
Important
If this parameter is enabled without other GUC-related parameters correctly configured, real-time resource consumption cannot be recorded.
resource_track_cost
Value range: an integer ranging from -1 to INT_MAX
Default value: 100000
Expected DMS value: 0 (for reference only)
Function: Specifies the minimum execution cost of statement resource monitoring for the current session. This parameter is valid only when enable_resource_track is on.
Important
If this parameter is set to a small value, more statements will be recorded, causing record expansion and affecting cluster performance.
resource_track_level
Value range: enumerated type
Default value: query
Expected DMS value: query (for reference only)
Function: Specifies the resource monitoring level for the current session. This parameter is valid only when enable_resource_track is on.
Important
If the resource monitoring is set to operator-level, performance will be greatly affected.
resource_track_duration
Value range: an integer ranging from 0 to INT_MAX, in seconds
Default value: 60.
Expected DMS value: 0 (for reference only)
Function: Specifies the minimum statement execution time that determines whether information about jobs of a statement recorded in the real-time view will be dumped to a historical view after the statement is executed. That is, only statements whose execution time exceeds the specified time are recorded in the historical view. This parameter is valid only when enable_resource_track is on.
Important
If this parameter is set to a small value, the batch processing mechanism for dumping kernel statements becomes invalid, affecting the kernel performance.
topsql_retention_time
Value range: an integer ranging from 0 to 3650, in days
Default value: 30
Expected DMS value: 14 (for reference only)
Function: Specifies the aging time of pgxc_wlm_session_info data in the view.
Important
If this parameter is set to 0, data will not be aged, which will cause storage expansion.
enable_resource_record
Value range: boolean
Default value: off
Expected DMS value: on (for reference only)
Function: Specifies whether to enable the archiving function for resource monitoring records. When this function is enabled, records in the history views (GS_WLM_SESSION_HISTORY and GS_WLM_OPERATOR_HISTORY) are archived to the info views (GS_WLM_SESSION_INFO and GS_WLM_OPERATOR_INFO) every 3 minutes. After the archiving, records in the history views are deleted.
Important
When this parameter is enabled, you are advised to set topsql_retention_time properly to configure the aging time. Otherwise, data in the GS_WLM_SESSION_INFO or GS_WLM_OPERATOR_INFO table will expand.