Settings
The Monitoring page displays the collection period and data aging period of monitoring metrics.
Note
The cluster monitoring function is enabled by default.
Disable the function if the cluster is being recovered. Enable the function when the fault is rectified.
When a node in the cluster is powered off or the IP address of the dedicated cluster is unavailable, the cluster monitoring switch and the button for configuring cluster metric collection are unavailable.
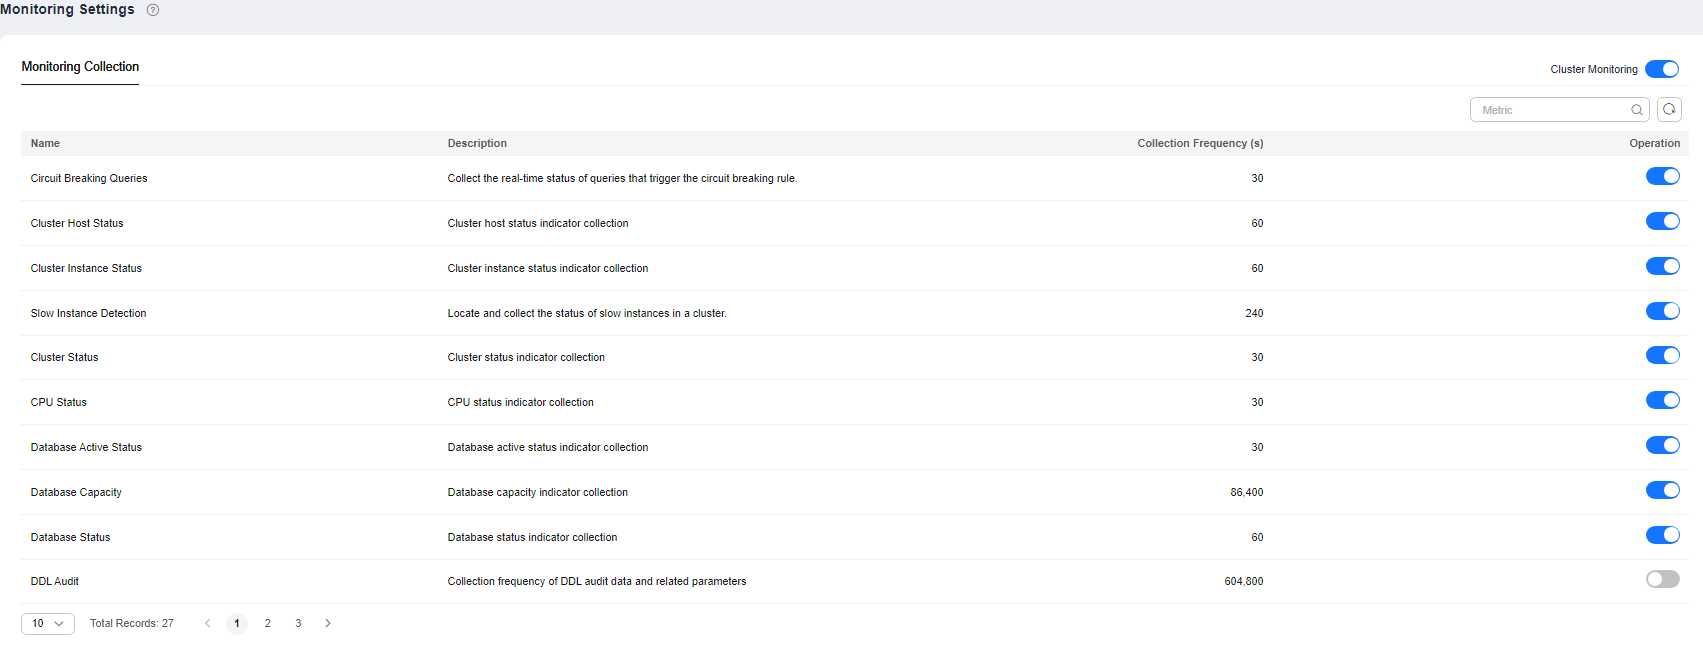
Monitoring Collection
Log in to the GaussDB(DWS) management console.
On the Clusters > Dedicated Clusters page, locate the cluster to be monitored.
In the Operation column of the target cluster, choose Monitoring Panel. The database monitoring page is displayed.
In the navigation pane on the left, choose Monitoring Settings > Monitoring Collection. You can reconfigure the collection frequency or disable the collection of the monitoring item.