Resource Pool Monitoring
Accessing the Resource Monitoring Page
Log in to the GaussDB(DWS) management console.
On the Clusters > Dedicated Clusters page, locate the cluster to be monitored.
In the Operation column of the target cluster, click Monitoring Panel.
In the navigation pane on the left, choose Monitoring > Resource Pool Monitoring.
You can check the real-time statistics and resource consumption history about resource pools.
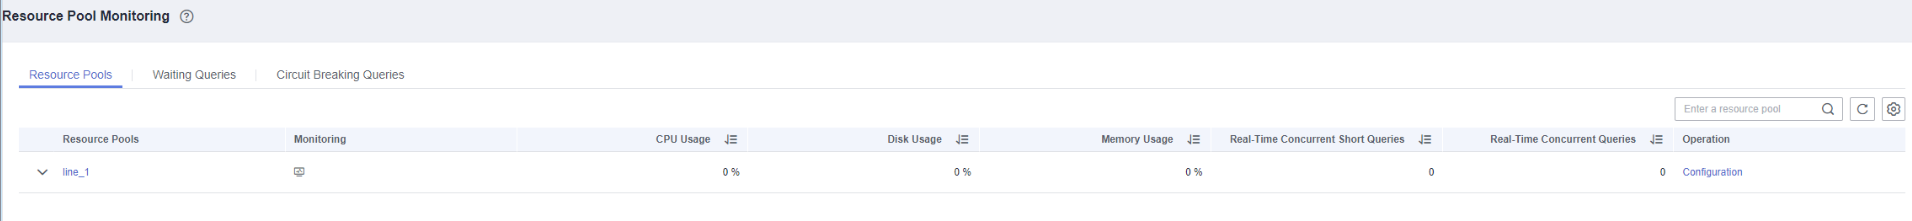
Resource Pool
You can check user-defined resource pools, real-time and historical resource consumption, and the resource quotas of resource pools.
Resource Pool: Resource pool name.
Monitoring: You can click the monitoring icon to display the historical consumption trends of resources such as the CPU, memory, and disk.
CPU Usage (%): real-time CPU usage of a resource pool
CPU Share (%): CPU usage share of a resource pool
Real-Time Concurrent Short Queries: number of concurrent simple queries in a resource pool. Concurrent simple queries are not controlled by the resource pool.
Concurrent Short Queries: quota of simple concurrent queries in a resource pool
Real-Time Concurrent Queries: number of concurrent complex queries in a resource pool. Concurrent complex queries are controlled by the resource pool.
Query Concurrency: quota of complex concurrent queries in a resource pool
Storage (MB): storage space of a resource pool
Disk Usage (%): real-time disk usage of a resource pool
Memory Resource: memory quota of a resource pool
Memory Usage (%): percentage of used memory
Operation
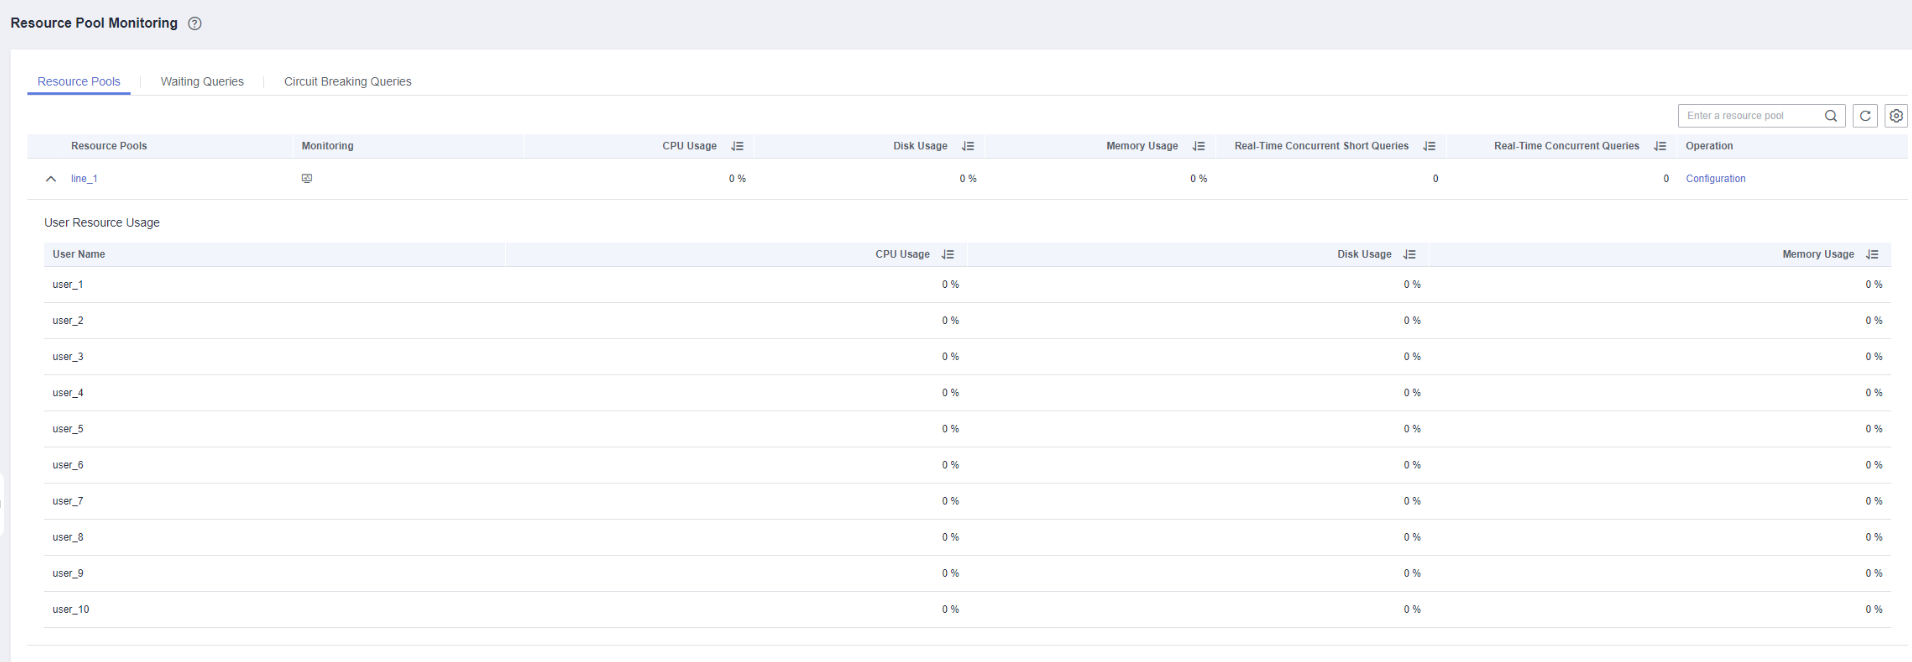
User Resource Usage
Click the arrow next to a resource pool name to expand resource usage details.
User Name: name of a user in the current resource pool
CPU Usage (%): real-time CPU usage of a user
CPU Resource: number of CPU cores used
Storage Resource (MB): storage space used by a user
Disk Usage (%): disks used by a user
Memory Resource (MB): memory used by a user
Memory Usage (%): percentage of memory used by a user
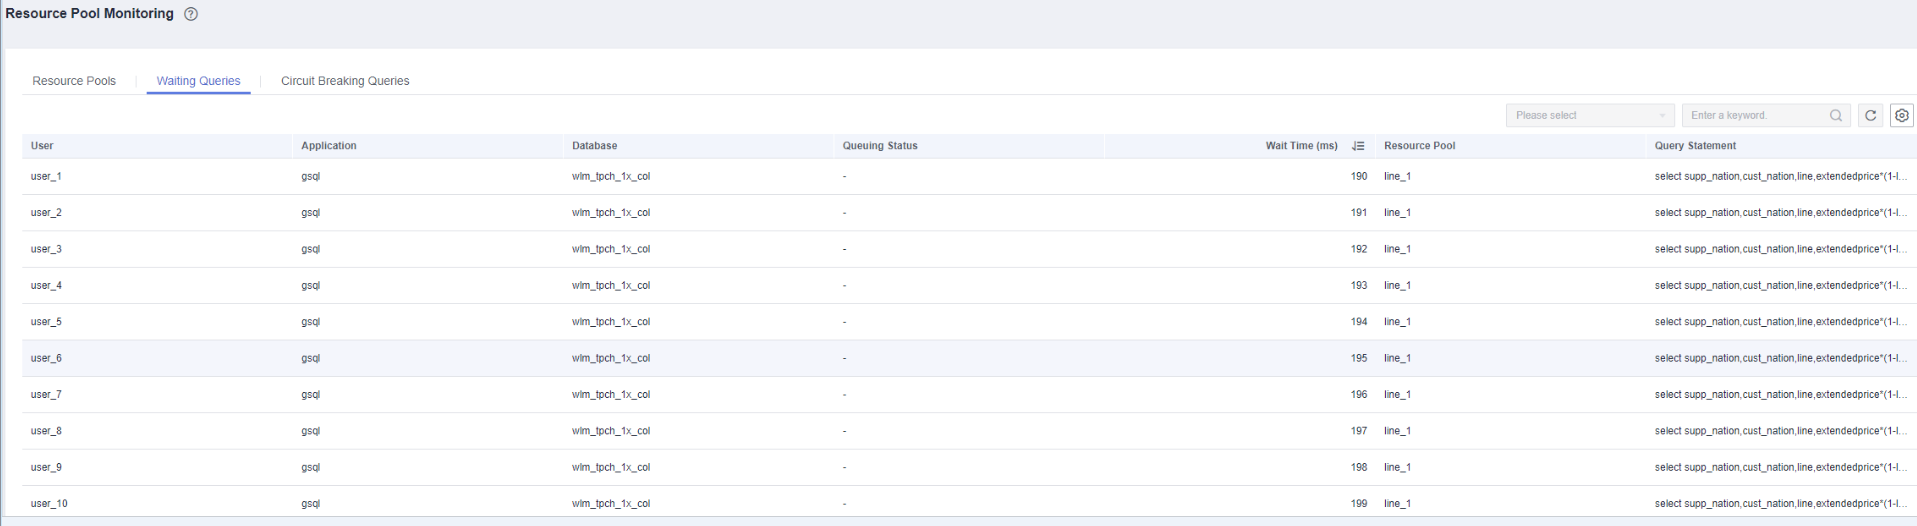
Queries Waiting in a Resource Pool
You can view the queries waiting in a resource pool in real time to check workload status.
User: user name of a query statement
Application: application name of a query statement
Database: name of the database to which a query statement is connected
Queuing Status: queuing status of a query statement in a resource pool
Wait Time: waiting time before a query statement is executed, in ms
Resource Pool: resource pool that the query belongs to
Query Statement: details of a query statement submitted by a user
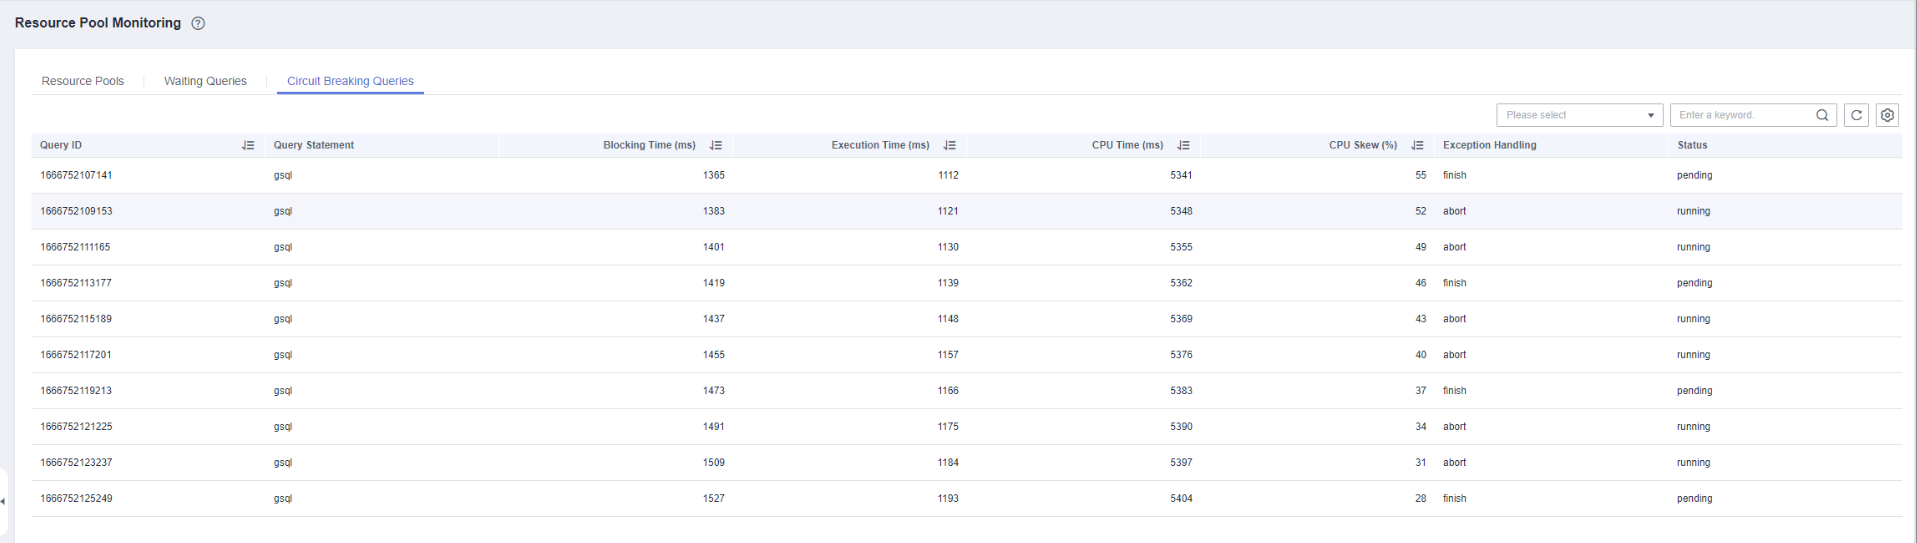
Checking Circuit Breaking Queries
You can view the status of a triggered circuit breaking query in a resource pool.
Query ID: ID of a circuit breaking query
Query Statement: circuit breaking query statement
Blocking Time (ms): blocking time of a circuit breaking statement, in ms
Execution Time (ms): execution time of a circuit breaking statement, in ms
CPU Time (ms): CPU time consumed by a circuit breaking statement, in ms
CPU Skew (%): CPU skew of a circuit breaking statement on each DN
Exception Handling: exception handling method of a circuit breaking statement
Status: real-time status of a circuit breaking statement