Database Monitoring
Database Monitoring
Log in to the GaussDB(DWS) management console.
On the Clusters > Dedicated Clusters page, locate the cluster to be monitored.
In the Operation column of the target cluster, click Monitoring Panel. The database monitoring page is displayed.
In the navigation pane on the left, choose Monitoring > Database Monitoring.
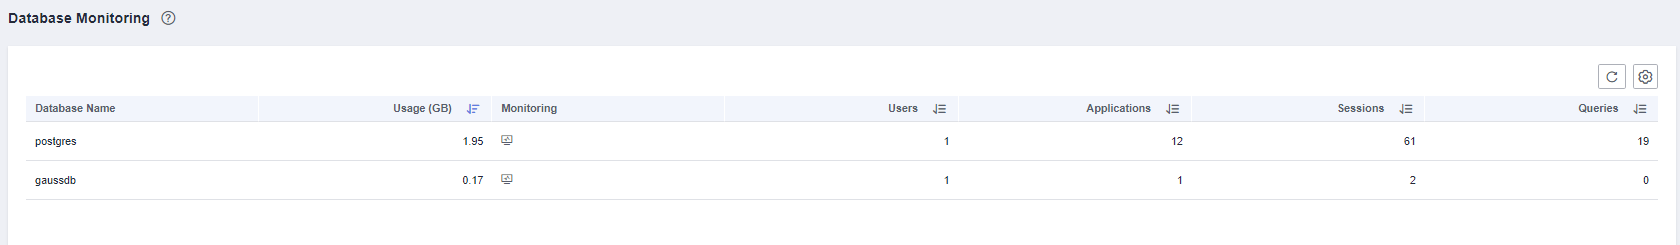
The Database Monitoring page displays the real-time and historical resource consumption a database.
Database Resource Consumption
You can select a database and check its resource usage. For details, see Monitoring Metrics. including:
Database Name
Usage (GB)
Monitoring
Users
Applications
Sessions
Queries
Inserted Rows
Updated Rows
Deleted Rows
Deadlocks
Temporary Files
Temporary File Capacity
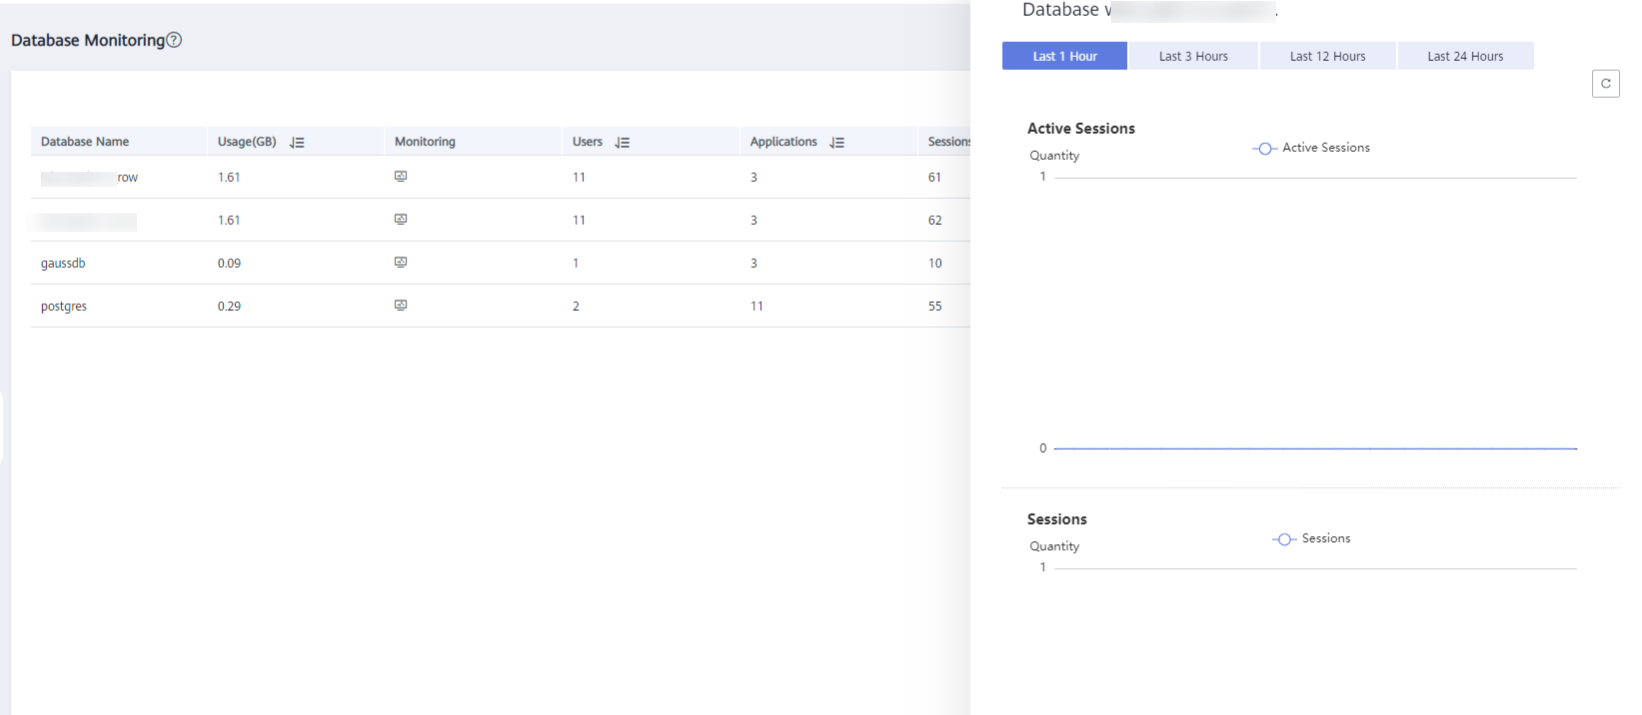
Database Trend Monitoring
In the Monitoring column of a database, click  to view the performance indicators of the database, including:
Capacity
Sessions
Queries