Cluster Overview
Cluster Overview
Log in to the GaussDB(DWS) management console.
On the Clusters > Dedicated Clusters page, locate the cluster to be monitored.
In the Operation column of the target cluster, click Monitoring Panel. The database monitoring page is displayed.
In the navigation pane on the left, click Cluster Overview.
On the page that is displayed, you can view the cluster status, real-time resource consumption, top SQL statements, cluster resource consumption, and key database metrics.
Note
Metrics can be collected and displayed on the cluster overview page only if their collection items are enabled. If a collection item is disabled, its metric will not be displayed, and a prompt will be displayed indicating this problem. In this case, you are advised to enable the collection item.
Cluster Status
In the Cluster Status area, you can view the statistics about the current cluster status and instance status, including cluster statistics in the last 24 hours, cluster specifications, available/total CNs and DNs, used/total disk capacity, the number of CCN switchovers in the last 24 hours, and the number of primary/standby DN switchovers in the last 24 hours.

Alarms
In the Alarms area, you can view all the uncleared alarms of the current cluster and the alarms generated in the last seven days. You can click More in the upper right corner to view details about the existing cluster alarms. For details, see Alarms.
Cluster Resources
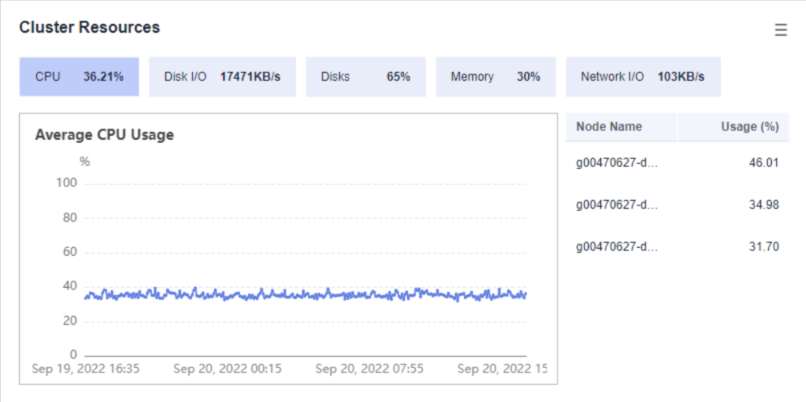
In the Cluster Resources area, you can view the resource usage of the current cluster, including the CPU usage, disk I/O, disk usage, memory usage, and network I/O. You can click the metric of a resource to view its trend in the last 24 hours and the top five services that are occupying this resource. You can click More in the upper right corner of the area to go to the Node Monitoring page. Nodes are sorted by the metric value. For details, see Node Monitoring.
Workloads
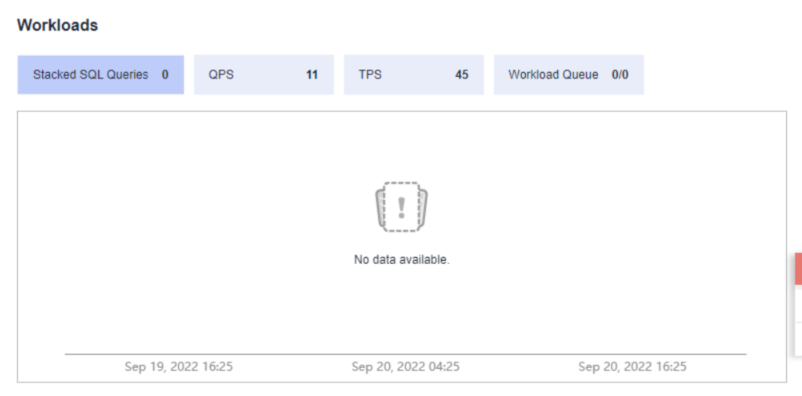
In the Workloads area, you can view the workload metrics of the current database, including TPS, QPS, stacked SQL queries, and running/queuing tasks in the resource pool. You can also click a workload metric to view its trend in the last 24 hours. The SQL Stack Queries metric depends on the real-time query monitoring function. If this function is disabled, no data will be displayed for the metric.
Data Volume
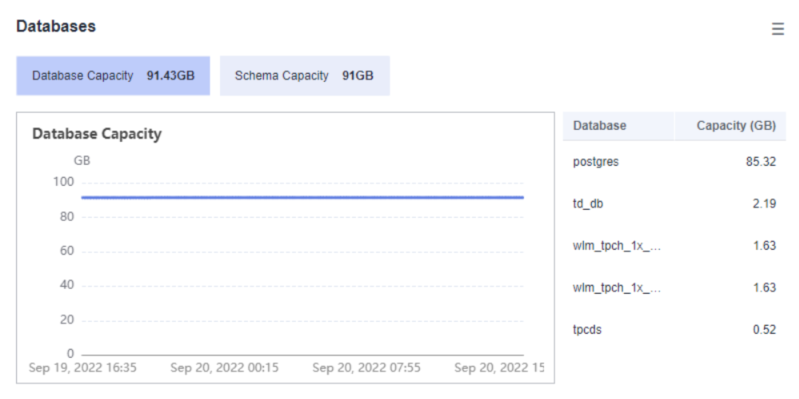
In the Data Volume area, you can view the used capacity of the current database and schema. You can click a capacity metric to view the database or schema capacity trend in the last 24 hours and the top five databases or schemas ranked by capacity usage in the current cluster. You can click More in the upper right corner of the area to go to the Database Monitoring page. Databases are sorted by used capacity. For details, see Database Monitoring.
Note
The database capacity data is collected once a day. Therefore, the data volume fluctuates greatly. To view real-time capacity monitoring information, choose Node Monitoring > Disks.
Queries
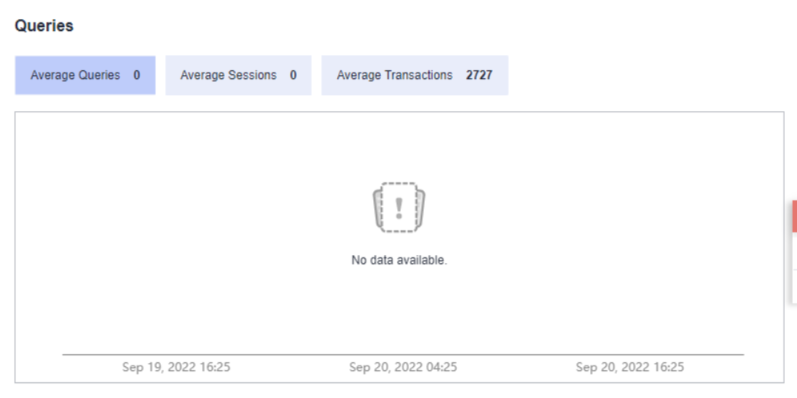
In the Queries area, you can check the average number of queries, sessions, and transactions. You can click a metric to view its trend in the last 24 hours. The Average Queries and Average Sessions metrics depend on the real-time query monitoring function. If this function is disabled, no data will be displayed for the metrics.
