Dashboard
The Dashboard page consists of the following parts:
Resources
In the Resources module, you can view the number of available resources, including Available/Total Clusters, Available/Total Nodes, and Used/Total Capacity.

Note
The used capacity refers to the space occupied by data in the database.
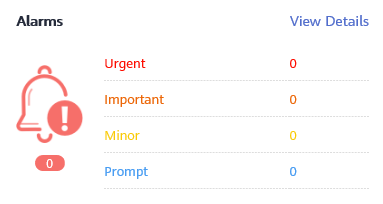
Alarms
Alarms are classified by severity: Urgent, Important, Minor, Prompt. For details, see Alarms.
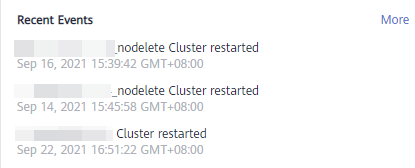
Recent Events
Events are records of changes in the user's cluster status. Events can be triggered by user operations or cluster status changes. For details, see Event Notifications.
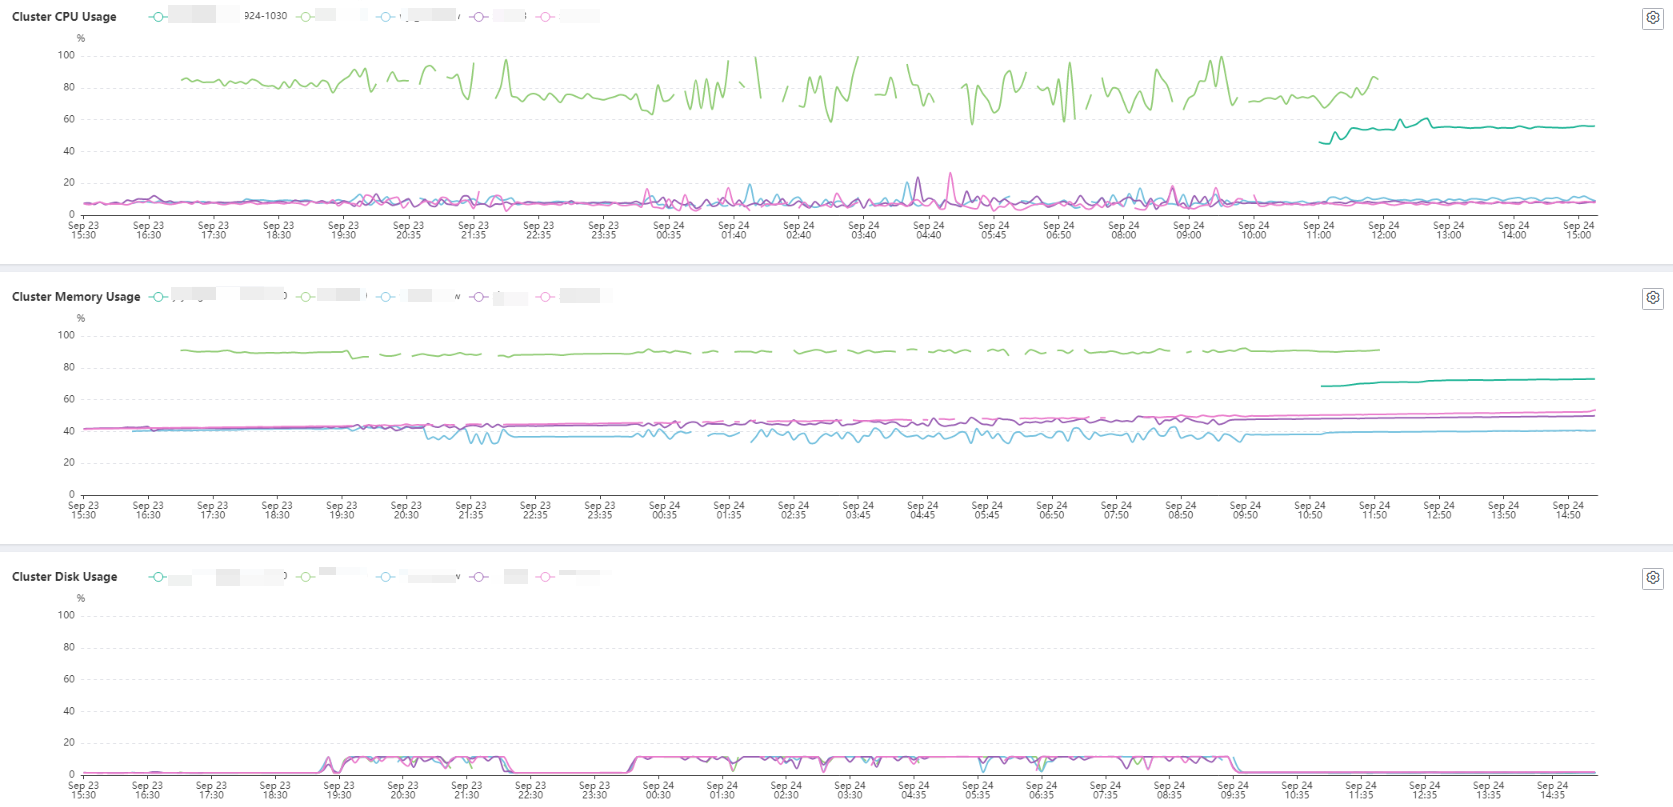
Main cluster metrics:
Cluster CPU Usage
Cluster Memory Usage
Cluster Disk Usage
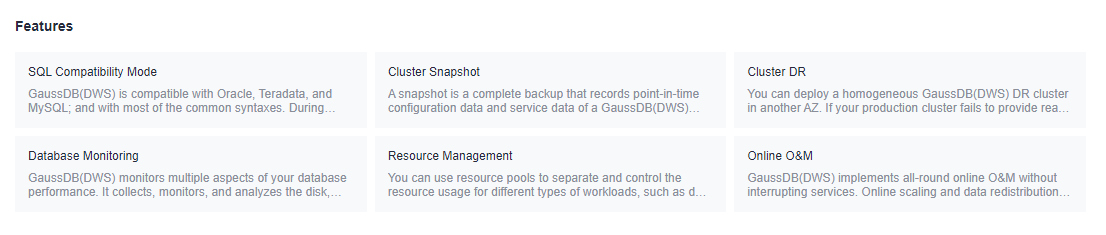
Features
This module describes multiple powerful functions of GaussDB(DWS), including SQL compatibility, cluster snapshot, cluster disaster recovery, database monitoring, resource management, and online O&M. You can quickly learn how they work and use them as required.