Alarm Management
Overview
Alarm management includes viewing and configuring alarm rules and subscribing to alarm information. Alarm rules display alarm statistics and details of the past week for users to view tenant alarms. In addition to providing a set of default GaussDB(DWS) alarm rules, this feature allows you to modify alarm thresholds based on your own services. GaussDB(DWS) alarm notifications are sent using the SMN service.
Note
This feature is supported only in cluster version 8.1.1.200 and later.
Currently, alarms cannot be categorized and managed by enterprise project.
Visiting the Alarms Page
Log in to the GaussDB(DWS) console.
In the navigation pane on the left, click Alarms.
On the page that is displayed:
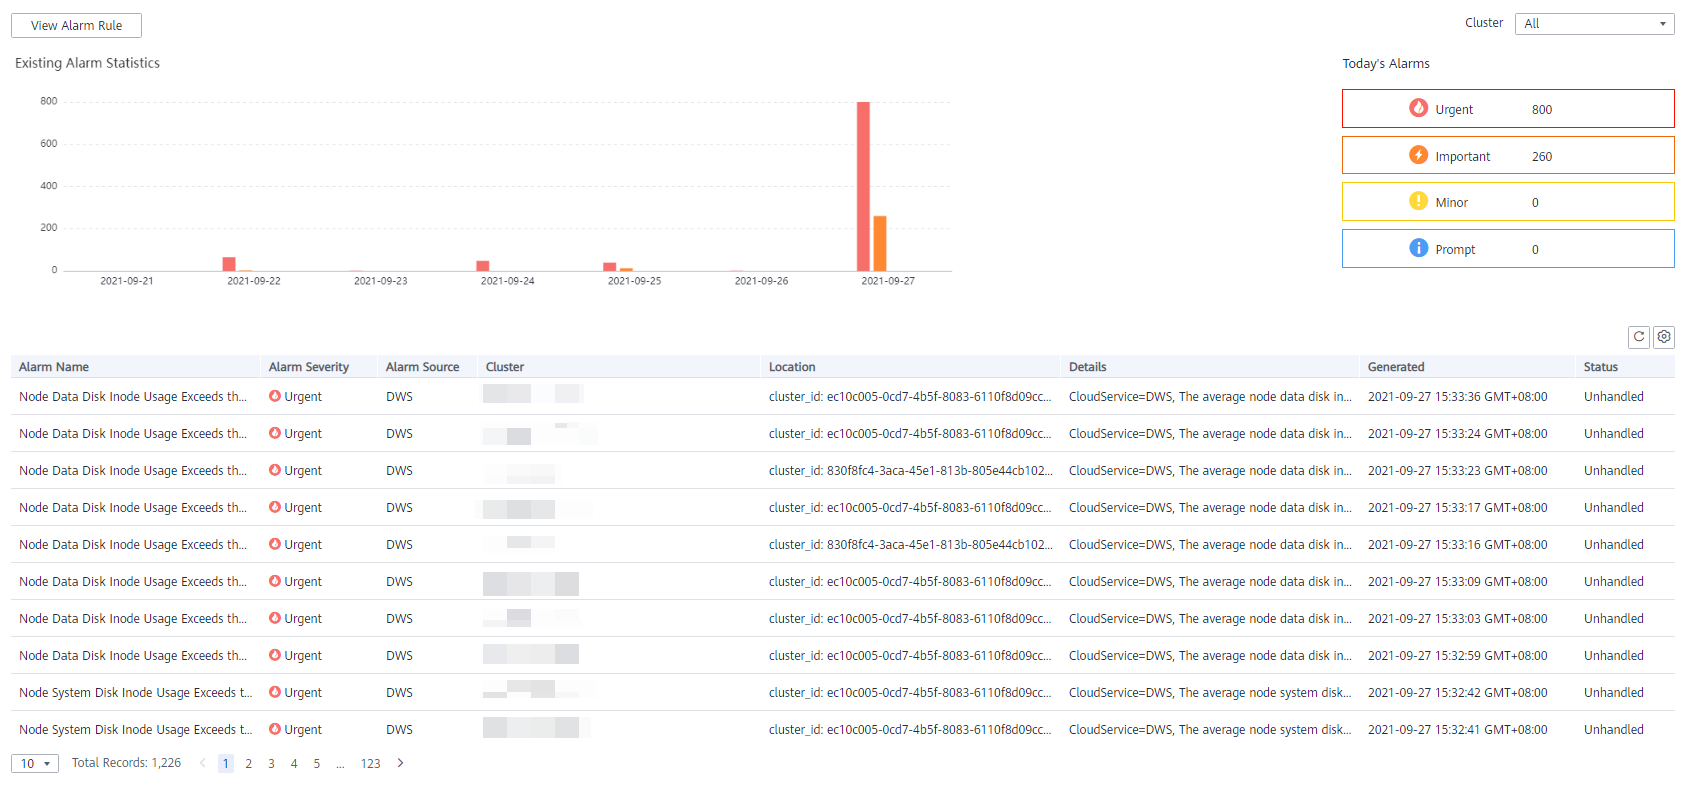
Existing Alarm Statistics
Statistics of the existing alarms in the past seven days are displayed by alarm severity in a bar chart. In this way, you can see clearly the number and category of the alarms generated in the past week.
Today's Alarms
Statistics of the existing alarms on the current day are displayed by alarm severity in a list. In this way, you can see clearly the number and category of the unhandled alarms generated on the day.
Alarm details
Details about all alarms, handled and unhandled, in the past seven days are displayed in a table for you to quickly locate faults, including the alarm name, alarm severity, cluster name, location, description, generation date, and status.

Note
The alarm data displayed (a maximum of 30 days) is supported by the Event Service microservice.
Alarm Types and Alarms
Note
The alarm policy is triggered based on the current configuration.
Type | Name | Severity | Description |
|---|---|---|---|
Default | Node CPU Usage Exceeds the Threshold | Urgent | This alarm is generated if the threshold of CPU usage (system + user) of any node in the cluster is exceeded within the specified period and the constraint is not met. The alarm will be cleared when the CPU usage (system + user) is lower than the threshold and the constraint is not met. |
Default | Node Data Disk Usage Exceeds the Threshold | Urgent: > 85%; Important: > 80% | This alarm is generated if the threshold of data disk (/var/chroot/DWS/data[n]) usage of any node in the cluster is exceeded within the specified period and the constraint is not met. The alarm will be cleared when the data disk (/var/chroot/DWS/data[n]) usage is lower than the threshold and the constraint is not met. |
Default | Node Data Disk I/O Usage Exceeds the Threshold | Urgent | This alarm is generated if the threshold of data disk (/var/chroot/DWS/data[n]) I/O usage (util) of any node in the cluster is exceeded within the specified period and the constraint is not met. The alarm will be cleared when the data disk (/var/chroot/DWS/data[n]) I/O usage (util) is lower than the threshold and the constraint is not met. |
Default | Node Data Disk Latency Exceeds the Threshold | Important | This alarm is generated if the threshold of data disk (/var/chroot/DWS/data[n]) I/O latency (await) of any node in the cluster is exceeded within the specified period and the constraint is not met. The alarm will be cleared when the data disk (/var/chroot/DWS/data[n]) I/O latency (await) is lower than the threshold and the constraint is not met. |
Default | Data Flushed to Disks of the Query Statement Exceeds the Threshold | Urgent | This alarm is generated if the threshold of data flushed to disks of the SQL statement in the cluster is exceeded within the specified period and the constraint is not met. The alarm can be cleared only after you handle the SQL statement. |
Default | Number of Queuing Query Statements Exceeds the Threshold | Urgent | This alarm is generated if the threshold of the number of queuing SQL statements is exceeded within the specified period. The alarm will be cleared when the number of queuing SQL statements is less than the threshold. |
Default | Queue congestion in the cluster default resource pool | Urgent | This alarm is generated if the queue in the default resource pool of a cluster is congested and no alarm suppression conditions are met. This alarm will be cleared if the queue is not congested. |
Default | Long SQL Probe Execution Duration in a Cluster | Urgent | This alarm is generated if the DMS alarm module detects a SQL probe execution duration on a server and no alarm suppression conditions are met. If no execution duration exceeds the threshold, the alarm will be automatically cleared. Note The alarm is supported only in 8.1.1.300 and later cluster versions. For earlier versions, contact technical support. |
Default | A vacuum full operation that holds a table lock for a long time exists in the cluster. | Important | In a specified period, the DMS alarm module detects that VACUUM FULL has been running for a long time in the cluster and blocks other operations. This alarm is generated if there are other SQL statements in the lock wait state and no suppression conditions are met. This alarm will be cleared if VACUUM FULL in the cluster did not cause lock wait. Note If this alarm is generated, contact technical support engineers. |
Custom | Name of the user-defined threshold alarm | User-defined alarm severity | Alarm description |