Using Breakpoints
This section contains the following topics:
A breakpoint is used to suspend the execution of a PL/SQL program at the row where the breakpoint is set. You can use breakpoints to control the execution and debug the function.
An enabled breakpoint suspends the execution of the PL/SQL program whenever a breakpoint is encountered. When the execution hits the row of breakpoint, the execution will stop and you will be able to carry out other debug operations. Data Studio supports the following breakpoint operations:
Setting or adding breakpoint on a row
Enabling or disabling a breakpoint on a row
Removing a breakpoint on a row
A disabled breakpoint will not suspend execution of PL/SQL program.
When you run a PL/SQL program, the execution pauses at every row where you set a breakpoint. When the program execution is paused, Data Studio retrieves information about the current program state, such as the values of the program variables.
Perform the following steps to debug a PL/SQL program:
Set a breakpoint at the row where PL/SQL program execution should be paused.
Start the debugging session.
When a row with a breakpoint is reached, monitor the state of the application in the debugger pane, and continue the execution.
Close the debugging session.
Data Studio provides debugging options in the toolbar that helps you step through the debug objects.
Using the Breakpoints Pane
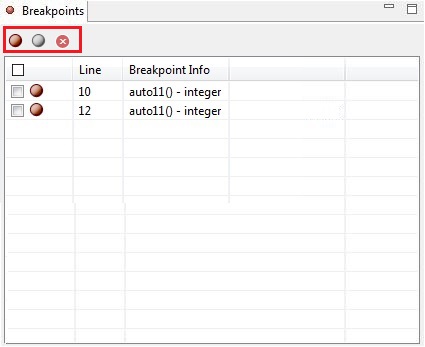
You can use the Breakpoints pane to view and manage the currently set breakpoints. From the minimized window panel, click the breakpoint option to open the Breakpoints pane.
The Breakpoints pane lists each breakpoint with the row number and the debug object name.
You can enable or disable all the breakpoints by clicking  in the Breakpoints pane. You can enable, disable or remove a specific breakpoint by selecting the breakpoint check box and clicking
  ,
,  or
or  in the Breakpoints pane.
Double-click the required breakpoint in the Breakpoint Info column to locate the breakpoint in the PL/SQL Viewer pane.
Note
Disabling a breakpoint prevents the execution from pausing at the breakpoint, but leaves the definition in place (to enable the breakpoint later).
Deleting a breakpoint removes it permanently.
The content of the Breakpoints pane can be copied to the clipboard using Alt+Y.
Setting or Adding Breakpoints on a Row
Follow the steps to set or add breakpoints on a row:
Open the PL/SQL function on a row where you want to add a breakpoint.
In the PL/SQL Viewer, double-click the breakpoint ruler on the left side of the Line column. The added breakpoint is indicated by an enable breakpoint sign [
 ] in the PL/SQL Viewer.
Note
If the execution of the function does not break or stop the breakpoint during debugging, the breakpoint that is already set will not be validated.
Enabling or Disabling a Breakpoint on a Row
Once a breakpoint is set, you can temporarily disable it by selecting the corresponding check box in the left-side of the Breakpoints pane and clicking  at the top of the Breakpoints pane. Disabled breakpoints will be grayed out [
 ] in the PL/SQL Viewer and Breakpoints pane. To enable a disabled breakpoint, select the corresponding breakpoint (using check box) and click
  .
.
Removing a Breakpoint on a Row
You can remove an unused breakpoint using the same method as that for creating a breakpoint.
In the PL/SQL Viewer tab, open the function in which you want to remove the breakpoint. Double-click  in the PL/SQL Viewer to disable the breakpoint. The breakpoint is removed from the work area.
You can also enable or disable breakpoints using the preceding method.
Changing Source Code
During debugging, if the source code is changed after it is fetched from the server and the debugging is continued, Data Studio displays an error.
You are advised to refresh the object and perform the debug operation again.
Note
If the source code is changed after it is fetched from the server, and if you perform the execution or debug operation with no breakpoint set, then the result of the source code at the server will be displayed on Data Studio. You are advised to refresh before performing debug or execute operation.
Debugging a PL/SQL Program Using a Breakpoint
Perform the following steps to debug a PL/SQL program using a breakpoint:
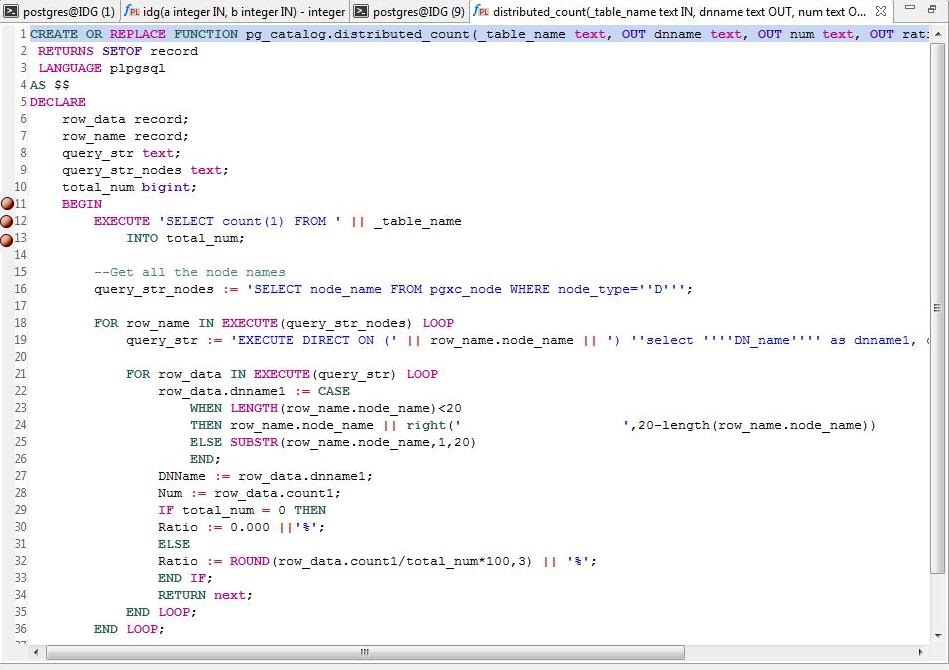
Open the PL/SQL program and add a breakpoint on the row to be debugged.
An example is as follows:
Rows 11, 12, 13
To start debugging, click
 or press Ctrl+D, or right-click the selected PL/SQL program in the Object Browser and select Debug. In the Debug Function/Procedure dialog box, enter the parameter information.
Note
If there is no input parameter, the Debug Function/Procedure dialog box will not be displayed.
Enter the information and click OK. Single quotation marks (') are mandatory for the parameters of varchar and date data types, but not mandatory for the parameters of numeric data type.
To set NULL as the parameter value, enter NULL or null.
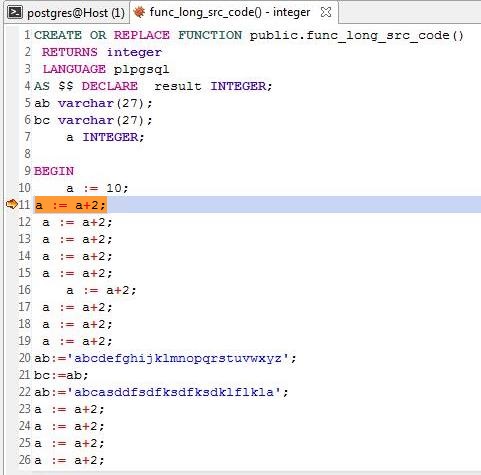
On clicking the Debug button, you will see an arrow
 pointing to the row where the breakpoint is set. The arrow indicates the row number at which execution will resume from.
You can terminate debugging by clicking
 from the toolbar, or pressing F10, or select Terminate Debugging from the Debug menu. After the debugging is complete, the function execution proceeds and will not be terminated at any breakpoint.
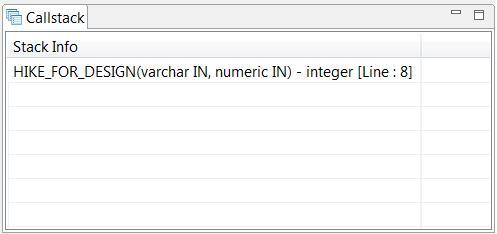
The Callstack and Variables panes are populated.
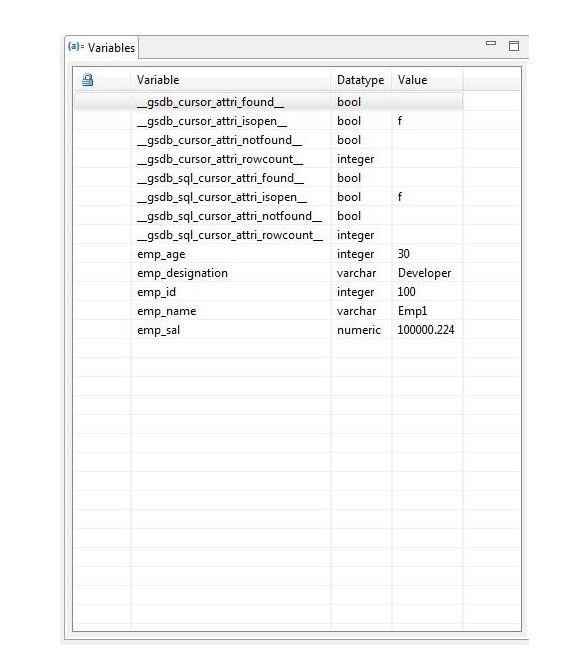
The Variables pane shows the current value of variables. Mouse over the variable in the function/procedure also shows the current value of variables.
You can step through the code using Step Into, Step Out or Step Over. For details, see Controlling Execution.
Click Continue
 to continue the execution till the next breakpoint (if any). The result of the executed PL/SQL program is displayed in the Result tab and the Callstack and Variables panes are cleared. You can copy the content of the Result tab, by clicking
  .
.To remove the breakpoint, do the following:
Double-click again on the breakpoint to remove it from the PL/SQL Viewer.
Select the breakpoint in the breakpoint check box and click
 in the Breakpoints pane.
Rearranging the Variable Window
This feature enables the Variable Window and columns to be rearranged. You are able to arrange Variable Window to the following places:
Next to the SQL Assistant tab
Next to the SQL Terminal tab
Next to the Object Browser tab
Next to the Resultset tab
Next to the Breakpoints tab
Next to the Callstack tab
Next to the Object Browser tab
Note
When debugging is finished, the variable window will be minimized even if the variable window is rearranged while debugging. If variable window is rearranged as the Terminal tab or the Result tab, on completion of debugging, the tab should be minimized manually. The position of variable window is maintained after it is rearranged.
Enabling/Disabling System Variables
System Variables are displayed by default. You can disable the system variables whenever required.
Click the red button under Variables to disable system variables.
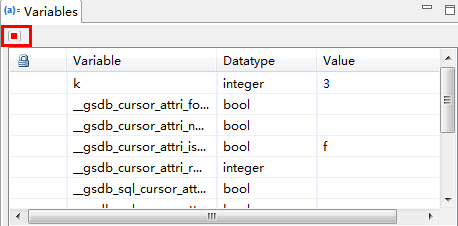
The button is in ON state by default.
Displaying Cached Parameters
When a PL/SQL function or procedure is debugged or executed, the same parameter values are used for the next debugging or execution.
While executing a PL/SQL object, following window is displayed:
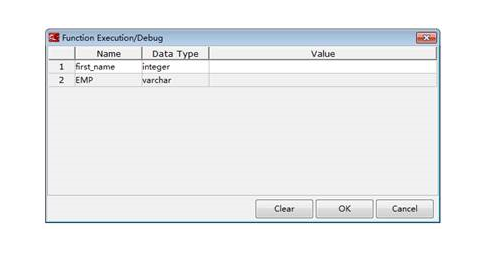
For the first time, parameter values are empty. Enter the value as required.
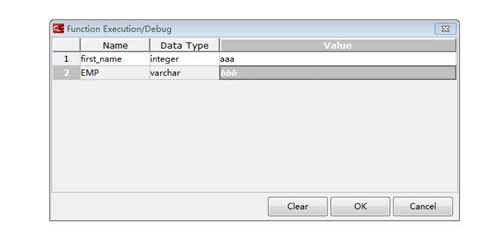
Click OK. The parameter values will be cached. Next time during the query execution/debug same parameter values will be displayed.
Note
Once the specific connection is removed, all the parameter values in cache are cleared.
Displaying Variable in Monitor Window
Data Studio displays the variables which are being monitored in the Monitor Window while debugging.
In the Monitor Window, variables must be added in following ways:
Add selected variables from the Variable window and right-click the variable.
Select variables from the Variable window and add variables by clicking the button in the Variable window toolbar.
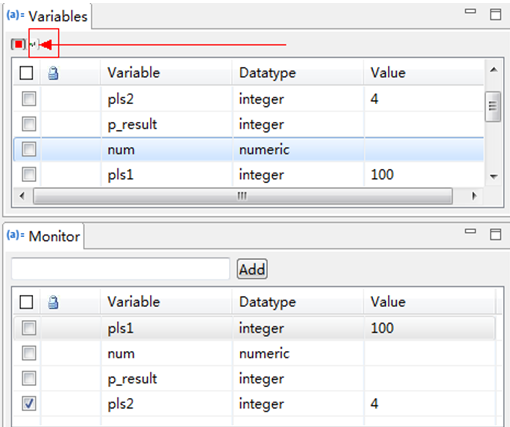
If the value is changed in the variable window, the same would reflect in the monitor window if the variable is monitored and vice versa.
During function/procedure debugging, right-click the variable to be added in the editor and add the variable to the Monitor window.
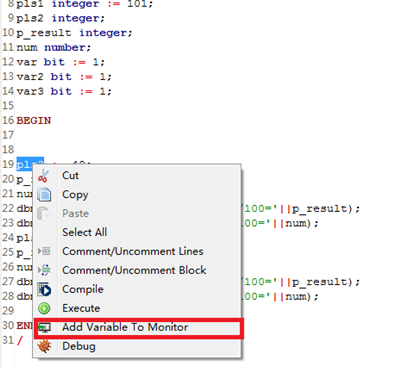
The Monitor window can be dragged to anywhere in the Data Studio window.
Displaying Cursor Information for Variables During Debugging
In Data Studio, variable information is displayed if the cursor is hovered over that variable during the debugging of PL/SQL functions.

Supporting Rollback/Commit During Debugging
Data Studio provides the option to commit/rollback the PL/SQL query execution result after debugging is finished.
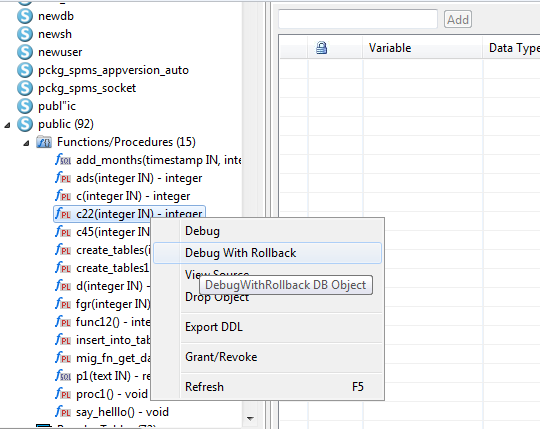
If Debug With Rollback option is enabled, the PL/SQL execution result after debugging is not saved to the database.
If Debug With Rollback option is disabled, the PL/SQL execution result after debugging is submitted to the database.
Perform the following steps to enable the rollback function:
Check the Debug With Rollback box to enable the rollback function during PL/SQL debugging.
Or
Right-click the SQL Terminal window where the PL/SQL function is executed.
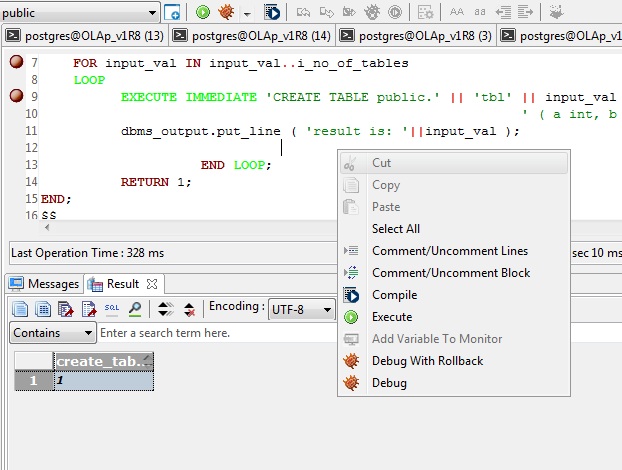
Select Debug With Rollback to enable the rollback function after the debugging is complete.
Or
Right-click any PL/SQL function under Functions/Procedure in Object Browser.
