Controlling Execution
This section contains the following topics:
Starting Debugging
Select the function that you want to debug in the Object Browser pane. Start debugging by clicking  on the toolbar (or any other method as mentioned in the earlier sections). If no breakpoint is set, or the set breakpoint is invalid, the debugging operation will not halt at any statement and Data Studio will simply execute the object and display the results (if any).
Stepping Through a PL/SQL Function
You can step through the debugging execution using the debug step commands from the toolbar. Step controls are used to step through the execution of the program line by line. If a breakpoint is encountered while performing a step operation, the execution will suspend at the breakpoint and the step operation is ended.
Stepping is the process of running one statement at a time. After stepping through a statement, you can see the execution result in other debugging tabs.
Note
A maximum of 100 PL/SQL Viewer tabs can be displayed at a time. If a new tab beyond 100 is opened, the tab of the calling function is closed. For example, if 100 tabs are already opened and if one of the debug objects calls a new debug object (other than already opened 100 tabs), then Data Studio will close the calling function, and open the new debug object.
Step Into
To step through code one statement at a time, select Step Into from the Debug menu, or click  , or press F7.
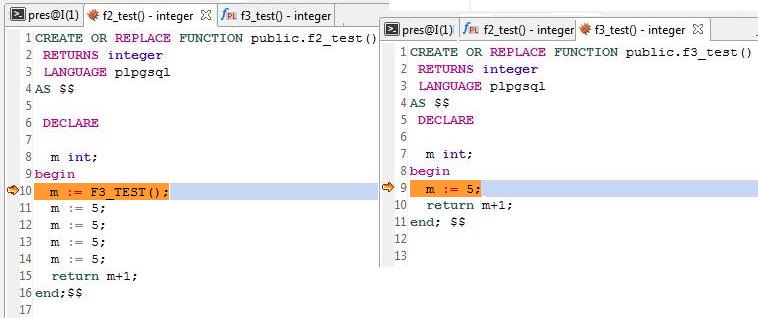
When stepping into a function, Data Studio executes the current statement and then enters the break mode. The debug position will be indicated by an arrow  on the left ruler pane. If the executed statement calls another function, Data Studio will step into that function. Once you have stepped through all the statements in that function, Data Studio will jump back to the next statement of the function it was called from.
To go into the next statement, click the Step Into button or press F7 again. If you click the Continue button, PL/SQL code execution will continue.
An example is as follows:
When entering line 8, enter m := F3_TEST();. That is, go to the line 9 in f3_test(). You can step through all the statements in f3_test() by stepping into each line by clicking the Step Into button or pressing F7 repeatedly. Once you have stepped through all the statements in that function, Data Studio jumps to Line 10 in f2_test().
The currently debugging object is marked with the  symbol in the tab title with the function name.
Step Over
Stepping over is the same as Stepping into, except that when it reaches a call for another function, it will not step into the function. The function will run, and you will be brought to the next statement in the current function. F8 is the shortcut key for Step Over. However, if there is a breakpoint set inside the called function, Step Over will enter the function, and hit the set breakpoint.
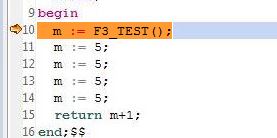
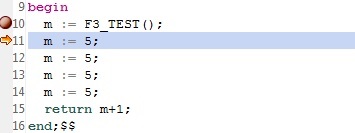
In the below example, when you click Step Over in Line 10, Data Studio runs the f3_test() function.
The cursor will be moved to the next statement in f2_test(), that is, Line 11 in f2_test().
You can step over a function when you are familiar with the way the function works and are sure that its execution will not affect the issue that you are investigating.
Note
Stepping over a line of code that does not contain a function call executes the line just like stepping into the line.
Step Out
Stepping out of a sub-program continues execution of the function and then suspends execution after the function returns to its calling function. You can step out of a long function when you have determined that the rest of the function is not significant to debug. However, if a breakpoint is set in the remaining part of the function, then that breakpoint will be hit before returning to the calling function.
Both stepping over and stepping out of a function will execute a function. The shortcut key for the step out operation is Shift+F7.
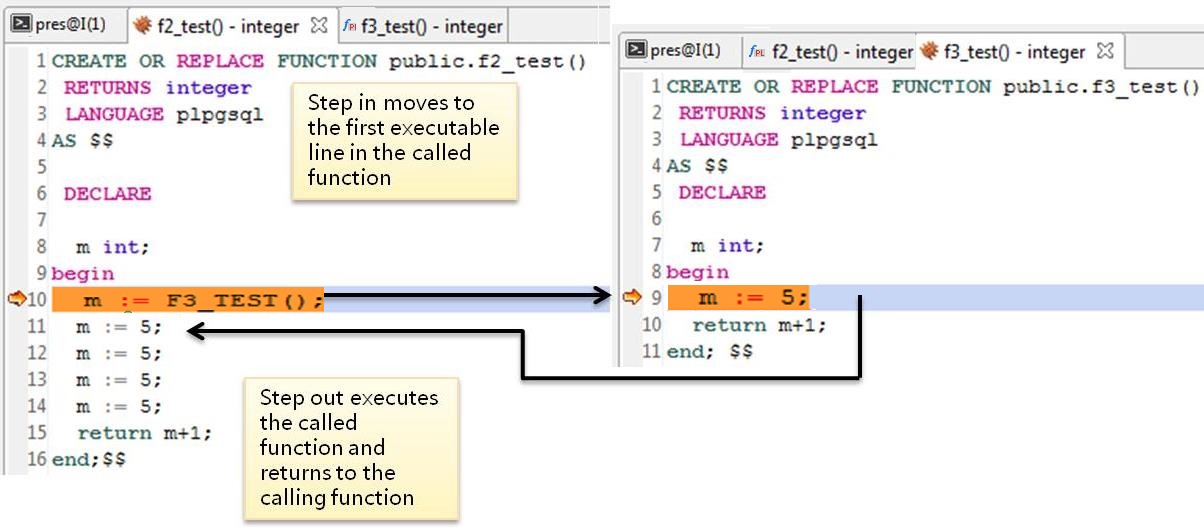
In the preceding example,
Choose Debug > Step Into to step into f3_test().
Choose Debug > Step Out to step out of f3_test()
Continuing the Debug Execution
When the debugging process stops at a specific location, you can select Continue (F9) from the Debug Menu or click  button from the toolbar to continue the PL/SQL function execution.
Viewing Callstack
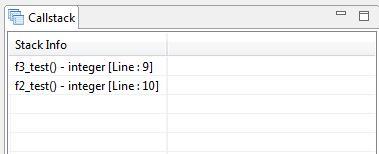
The Callstack pane displays the chain of functions as they are called. The Callstack pane can be opened from the minimized window panel. The most recent functions are listed on the top, and the least recent on the bottom. At the end of each function name is the current line number in that function.
You can navigate among multiple functions through the Callstack pane by double-clicking the function name in the Callstack pane. For example, when f2_test() calls f3_test() at Line 10, the debug pointer will point to the first valid executable line (which is Line 9, in the above example) in the called function.
In this case, the Callstack pane will be as shown below:
Note
The content of the Callstack pane can be copied to the clipboard using Alt+J.