TopSQL Query Example
In this section, TPC-DS sample data is used as an example to describe how to query Real-time Top SQL and Historical Top SQL.
Configuring Cluster Parameters
To query for historical or archived resource monitoring information about jobs of top SQLs, you need to set related GUC parameters first. The procedure is as follows:
Log in to the GaussDB(DWS) management console.
On the Cluster Management page, locate the required cluster and click the cluster name. The cluster details page is displayed.
Click the Parameter Modifications tab to view the values of cluster parameters.
Set an appropriate value for parameter resource_track_duration and click Save.
Note
If enable_resource_record is set to on, storage space expansion may occur and thereby slightly affects the performance. Therefore, set is to off if record archiving is unnecessary.
Go back to the Cluster Management page, click the refresh button in the upper right corner, and wait until the cluster parameter settings are applied.
Example for Querying for Top SQLs
The TPC-DS sample data is used as an example.
Open the SQL client tool and connect to your database.
Run the EXPLAIN statement to query for the estimated cost of the SQL statement to be executed to determine whether resources of the SQL statement will be monitored.
By default, only resources of a query whose execution cost is greater than the value of resource_track_cost are monitored and can be queried by users.
For example, run the following statements to query for the estimated execution cost of the SQL statement:
SET CURRENT_SCHEMA = tpcds;
EXPLAIN WITH customer_total_return AS
( SELECT sr_customer_sk as ctr_customer_sk,
sr_store_sk as ctr_store_sk,
sum(SR_FEE) as ctr_total_return
FROM store_returns, date_dim
WHERE sr_returned_date_sk = d_date_sk AND d_year =2000
GROUP BY sr_customer_sk, sr_store_sk )
SELECT  c_customer_id
FROM customer_total_return ctr1, store, customer
WHERE ctr1.ctr_total_return > (select avg(ctr_total_return)*1.2
FROM customer_total_return ctr2
WHERE ctr1.ctr_store_sk = ctr2.ctr_store_sk)
AND s_store_sk = ctr1.ctr_store_sk
AND s_state = 'TN'
AND ctr1.ctr_customer_sk = c_customer_sk
ORDER BY c_customer_id
limit 100;
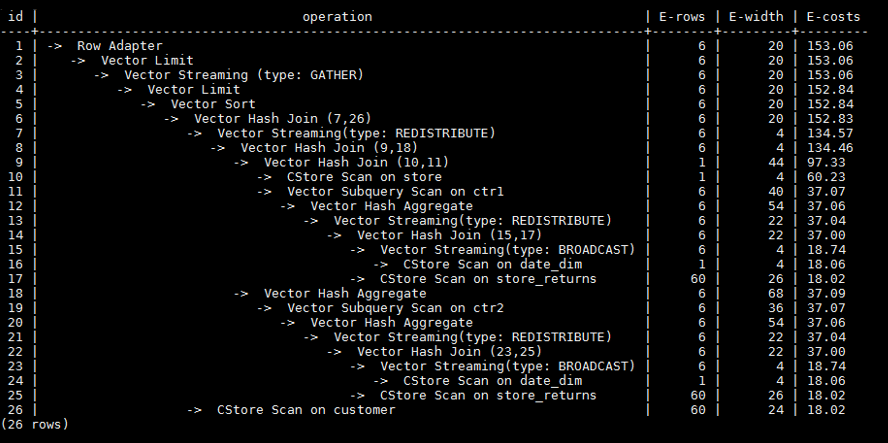
In the following query result, the value in the first row of the E-costs column is the estimated cost of the SQL statement.

Figure 1 EXPLAIN result
In this example, to demonstrate the resource monitoring function of TopSQL, you need to set resource_track_cost to a value smaller than the estimated cost in the EXPLAIN result, for example, 100. For details about the parameter setting, see resource_track_cost.
Note
After completing this example, you still need to reset resource_track_cost to its default value 100000 or a proper value. An overly small parameter value will compromise the database performance.
Run SQL statements.
SET CURRENT_SCHEMA = tpcds;
WITH customer_total_return AS
(SELECT sr_customer_sk as ctr_customer_sk,
sr_store_sk as ctr_store_sk,
sum(SR_FEE) as ctr_total_return
FROM store_returns,date_dim
WHERE sr_returned_date_sk = d_date_sk
AND d_year =2000
GROUP BY sr_customer_sk ,sr_store_sk)
SELECT  c_customer_id
FROM customer_total_return ctr1, store, customer
WHERE ctr1.ctr_total_return > (select avg(ctr_total_return)*1.2
FROM customer_total_return ctr2
WHERE ctr1.ctr_store_sk = ctr2.ctr_store_sk)
AND s_store_sk = ctr1.ctr_store_sk
AND s_state = 'TN'
AND ctr1.ctr_customer_sk = c_customer_sk
ORDER BY c_customer_id
limit 100;
During statement execution, query for the real-time memory peak information about the SQL statement on the current CN.
SELECT query,max_peak_memory,average_peak_memory,memory_skew_percent FROM gs_wlm_session_statistics ORDER BY start_time DESC;
The preceding command queries for the real-time peak information at the query-level. The peak information includes the maximum memory peak among all DNs per second, average memory peak among all DNs per second, and memory usage skew across DNs.
For more examples of querying for the real-time resource monitoring information of top SQLs, see Real-time Top SQL.
Wait until the SQL statement execution in 3 is complete, and then query for the historical resource monitoring information of the statement.
SELLECT query,start_time,finish_time,duration,status FROM gs_wlm_session_history ORDER BY start_time DESC;
The preceding command queries for the historical information at the query-level. The peak information includes the execution start time, execution duration (unit: ms), and execution status. The time unit is ms.
For more examples of querying for the historical resource monitoring information of top SQLs, see Historical Top SQL.
Wait for 3 minutes after the execution of the SQL statement in 3 is complete, query for the historical resource monitoring information of the statement in the info view.
If enable_resource_record is set to on and the execution time of the SQL statement in 3 is no less than the value of resource_track_duration, historical information about the SQL statement will be archived to the gs_wlm_session_info view 3 minutes after the execution of the SQL statement is complete.
The info view can be queried only when the postgres database is connected. Therefore, switch to the postgres database before running the following statement:
SELECT query,start_time,finish_time,duration,status FROM gs_wlm_session_info ORDER BY start_time desc;