SQL Execution Plan
An SQL execution plan is a node tree that displays the detailed steps performed when the GaussDB(DWS) executes an SQL statement. Each step indicates a database operator, also called an execution operator.
You can run the EXPLAIN command to view the execution plan generated for each query by an optimizer. EXPLAIN outputs a row of information for each execution node, showing the basic node type and the expense estimate that the optimizer makes for executing the node.
Execution Plan Information
In addition to setting different display formats for an execution plan, you can use different EXPLAIN syntax to display execution plan information in detail. The common usages are as follows. For more usages, see .
EXPLAIN statement: only generates an execution plan and does not execute. The statement indicates SQL statements.
EXPLAIN ANALYZE statement: generates and executes an execution plan, and displays the execution summary. Then actual execution time statistics are added to the display, including the total elapsed time expended within each plan node (in milliseconds) and the total number of rows it actually returned.
EXPLAIN PERFORMANCE statement: generates and executes the execution plan, and displays all execution information.
To measure the run time cost of each node in the execution plan, the current execution of EXPLAIN ANALYZE or EXPLAIN PERFORMANCE adds profiling overhead to query execution. Running EXPLAIN ANALYZE or PERFORMANCE on a query sometimes takes longer time than executing the query normally. The amount of overhead depends on the nature of the query, as well as the platform being used.
Therefore, if an SQL statement is not finished after being running for a long time, run the EXPLAIN statement to view the execution plan and then locate the fault. If the SQL statement has been properly executed, run the EXPLAIN ANALYZE or EXPLAIN PERFORMANCE statement to check the execution plan and information to locate the fault.
Description of common execution plan keywords:
Table access modes
Seq Scan/CStore Scan
Scans all rows of the table in sequence. These are basic scan operators, which are used to scan row-store and column-store tables in sequence.
Index Scan/CStore Index Scan
Scans indexes of row-store and column-store tables. There are indexes in row-store or column-store tables, and the condition column is the index column.
The optimizer uses a two-step plan: the child plan node visits an index to find the locations of rows matching the index condition, and then the upper plan node actually fetches those rows from the table itself. Fetching rows separately is much more expensive than reading them sequentially, but because not all pages of the table have to be visited, this is still cheaper than a sequential scan. The upper-layer planning node first sort the location of index identifier rows based on physical locations before reading them. This minimizes the independent capturing overhead.
If there are separate indexes on multiple columns referenced in WHERE, the optimizer might choose to use an AND or OR combination of the indexes. However, this requires the visiting of both indexes, so it is not necessarily a win compared to using just one index and treating the other condition as a filter.
The following Index scans featured with different sorting mechanisms are involved:
Bitmap Index Scan
To use a bitmap index to capture a data page, you need to scan the index to obtain the bitmap and then scan the base table.
Index Scan using index_name
Fetches table rows in index order, which makes them even more expensive to read. However, there are so few rows that the extra cost of sorting the row locations is unnecessary. This plan type is used mainly for queries fetching just a single row and queries having an ORDER BY condition that matches the index order, because no extra sorting step is needed to satisfy ORDER BY.
Table connection modes
Nested Loop
Nested-loop is used for queries that have a smaller data set connected. In a Nested-loop join, the foreign table drives the internal table and each row returned from the foreign table should have a matching row in the internal table. The returned result set of all queries should not exceed 10,000. The table that returns a smaller subset will work as a foreign table, and indexes are recommended for connection fields of the internal table.
(Sonic) Hash Join
A Hash join is used for large tables. The optimizer uses a hash join, in which rows of one table are entered into an in-memory hash table, after which the other table is scanned and the hash table is probed for matches to each row. Sonic and non-Sonic hash joins differ in their hash table structures, which do not affect the execution result set.
Merge Join
In a merge join, data in the two joined tables is sorted by join columns. Then, data is extracted from the two tables to a sorted table for matching.
Merge join requires more resources for sorting and its performance is lower than that of hash join. If the source data has been sorted, it does not need to be sorted again when merge join is performed. In this case, the performance of merge join is better than that of hash join.
Operators
sort
Sorts the result set.
filter
The EXPLAIN output shows the WHERE clause being applied as a Filter condition attached to the Seq Scan plan node. This means that the plan node checks the condition for each row it scans, and returns only the ones that meet the condition. The estimated number of output rows has been reduced because of the WHERE clause. However, the scan will still have to visit all 10000 rows. As a result, the cost is not decreased. It increases a bit (by 10000 x cpu_operator_cost) to reflect the extra CPU time spent on checking the WHERE condition.
LIMIT
LIMIT limits the number of output execution results. If a LIMIT condition is added, not all rows are retrieved.
Execution Plan Display Format
GaussDB(DWS) provides four display formats: normal, pretty, summary, and run. You can change the display format of execution plans by setting explain_perf_mode.
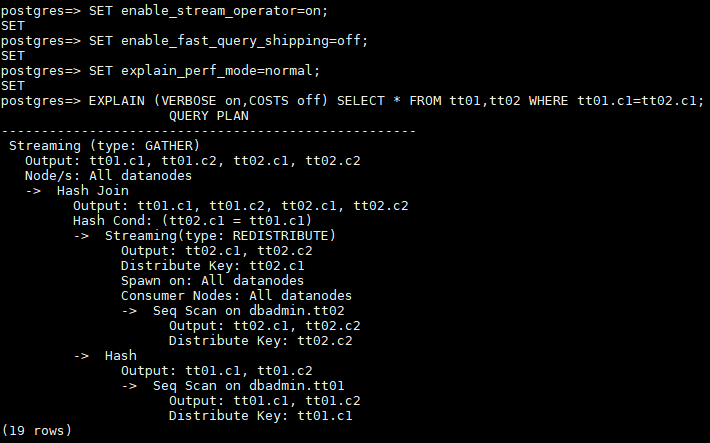
normal indicates that the default printing format is used. Figure 1 shows the display format.

Figure 1 Example of an execution plan in normal format
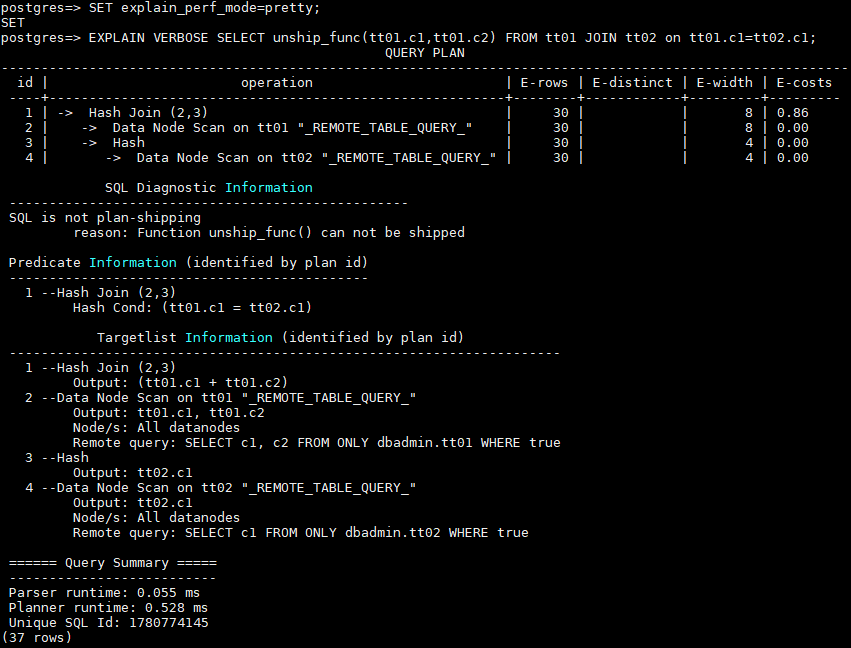
pretty indicates that the optimized display mode of GaussDB(DWS) is used. A new format contains a plan node ID, directly and effectively analyzing performance. Figure 2 is an example.

Figure 2 Example of an execution plan using the pretty format
summary indicates that the analysis result based on such information is printed in addition to the printed information in the format specified by pretty.
run indicates that in addition to the printed information specified by summary, the database exports the information as a CSV file.
Common Types of Plans
GaussDB(DWS) has three types of distributed plans:
Fast Query Shipping (FQS) plan
The CN directly delivers statements to DNs. Each DN executes the statements independently and summarizes the execution results on the CN.
Stream plan
The CN generates a plan for the statements to be executed and delivers the plan to DNs for execution. During the execution, DNs use the Stream operator to exchange data.
Remote-Query plan
After generating a plan, the CN delivers some statements to DNs. Each DN executes the statements independently and sends the execution result to the CN. The CN executes the remaining statements in the plan.
The existing tables tt01 and tt02 are defined as follows:
CREATE TABLE tt01(c1 int, c2 int) DISTRIBUTE BY hash(c1);
CREATE TABLE tt02(c1 int, c2 int) DISTRIBUTE BY hash(c2);
Type 1: FQS plan, all statements pushed down
Two tables are joined, and the join condition is the distribution column of each table. If the stream operator is disabled, the CN directly sends statements to each DN for execution. The result is summarized on the CN.
SET enable_stream_operator=off;
SET explain_perf_mode=normal;

EXPLAIN (VERBOSE on,COSTS off) SELECT * FROM tt01,tt02 WHERE tt01.c1=tt02.c2;
                                                    QUERY PLAN
-------------------------------------------------------------------------------------------------------------------
 Data Node Scan on "__REMOTE_FQS_QUERY__"
   Output: tt01.c1, tt01.c2, tt02.c1, tt02.c2
   Node/s: All datanodes
   Remote query: SELECT tt01.c1, tt01.c2, tt02.c1, tt02.c2 FROM dbadmin.tt01, dbadmin.tt02 WHERE tt01.c1 = tt02.c2
(4 rows)
Type 2: Non-FQS plan, some statements pushed down
Two tables are joined and the join condition contains non-distribution columns. If the stream operator is disabled, the CN delivers the base table scanning statements to each DN. Then, the JOIN operation is performed on the CN.
SET enable_stream_operator=off;
SET explain_perf_mode=normal;

EXPLAIN (VERBOSE on,COSTS off) SELECT * FROM tt01,tt02 WHERE tt01.c1=tt02.c1;
                                 QUERY PLAN
-----------------------------------------------------------------------------
 Hash Join
   Output: tt01.c1, tt01.c2, tt02.c1, tt02.c2
   Hash Cond: (tt01.c1 = tt02.c1)
   ->  Data Node Scan on tt01 "_REMOTE_TABLE_QUERY_"
         Output: tt01.c1, tt01.c2
         Node/s: All datanodes
         Remote query: SELECT c1, c2 FROM ONLY dbadmin.tt01 WHERE true
   ->  Hash
         Output: tt02.c1, tt02.c2
         ->  Data Node Scan on tt02 "_REMOTE_TABLE_QUERY_"
               Output: tt02.c1, tt02.c2
               Node/s: All datanodes
               Remote query: SELECT c1, c2 FROM ONLY dbadmin.tt02 WHERE true
(13 rows)
Type 3: Stream plan, no data exchange between DNs
Two tables are joined, and the join condition is the distribution column of each table. DNs do not need to exchange data. After generating a stream plan, the CN delivers the plan except the Gather Stream part to DNs for execution. The CN scans the base table on each DN, performs hash join, and sends the result to the CN.
SET enable_fast_query_shipping=off;
SET enable_stream_operator=on;

EXPLAIN (VERBOSE on,COSTS off) SELECT * FROM tt01,tt02 WHERE tt01.c1=tt02.c2;
                     QUERY PLAN
----------------------------------------------------
 Streaming (type: GATHER)
   Output: tt01.c1, tt01.c2, tt02.c1, tt02.c2
   Node/s: All datanodes
   ->  Hash Join
         Output: tt01.c1, tt01.c2, tt02.c1, tt02.c2
         Hash Cond: (tt01.c1 = tt02.c2)
         ->  Seq Scan on dbadmin.tt01
               Output: tt01.c1, tt01.c2
               Distribute Key: tt01.c1
         ->  Hash
               Output: tt02.c1, tt02.c2
               ->  Seq Scan on dbadmin.tt02
                     Output: tt02.c1, tt02.c2
                     Distribute Key: tt02.c2
(14 rows)
Type 4: Stream plan, with data exchange between DNs
When two tables are joined and the join condition contains non-distribution columns, and the stream operator is enabled (SET enable_stream_operator=on), a stream plan is generated, which allows data exchange between DNs. For table tt02, the base table is scanned on each DN. After the scanning, the Redistribute Stream operator performs hash calculation based on tt02.c1 in the JOIN condition, sends the hash calculation result to each DN, and then performs JOIN on each DN, finally, the data is summarized to the CN.
Type 5: Remote-Query plan
unship_func cannot be pushed down and does not meet partial pushdown requirements (subquery pushdown). Therefore, you can only send base table scanning statements to DNs and collect base table data to the CN for calculation.

EXPLAIN PERFORMANCE Description
You can use EXPLAIN ANALYZE or EXPLAIN PERFORMANCE to check the SQL statement execution information and compare the actual execution and the optimizer's estimation to find what to optimize. EXPLAIN PERFORMANCE provides the execution information on each DN, whereas EXPLAIN ANALYZE does not.
Tables are defined as follows:
CREATE TABLE tt01(c1 int, c2 int) DISTRIBUTE BY hash(c1);
CREATE TABLE tt02(c1 int, c2 int) DISTRIBUTE BY hash(c2);
The following SQL query statement is used as an example:
SELECT * FROM tt01,tt02 WHERE tt01.c1=tt02.c2;
The output of EXPLAIN PERFORMANCE consists of the following parts:
Execution Plan

The plan is displayed as a table, which contains 11 columns: id, operation, A-time, A-rows, E-rows, E-distinct, Peak Memory, E-memory, A-width, E-width, and E-costs. Table 1 describes the columns.
Table 1 Execution column description¶ Column
Description
id
ID of an execution operator.
operation
Name of an execution operator.
The operator of the Vector prefix refers to a vectorized execution engine operator, which exists in a query containing a column-store table.
Streaming is a special operator. It implements the core data shuffle function of the distributed architecture. Streaming has three types, which correspond to different data shuffle functions in the distributed architecture:
Streaming (type: GATHER): The CN collects data from DNs.
Streaming(type: REDISTRIBUTE): Data is redistributed to all the DNs based on selected columns.
Streaming(type: BROADCAST): Data on the current DN is broadcast to all other DNs.
A-time
Execution time of an operator on each DN. Generally, A-time of an operator is two values enclosed by square brackets ([]), indicating the shortest and longest time for completing the operator on all DNs, including the execution time of the lower-layer operators.
Note: In the entire plan, the execution time of a leaf node is the execution time of the operator, while the execution time of other operators includes the execution time of its subnodes.
A-rows
Actual rows output by an operator.
E-rows
Estimated rows output by each operator.
E-distinct
Estimated distinct value of the hashjoin operator.
Peak Memory
Peak memory used when the operator is executed on each DN. The left value in [] is the minimum value, and the right value in [] is the maximum value.
E-memory
Estimated memory used by each operator on a DN. Only operators executed on DNs are displayed. In certain scenarios, the memory upper limit enclosed in parentheses will be displayed following the estimated memory usage.
A-width
The actual width of each line of tuple of the current operator. This parameter is valid only for the heavy memory operator is displayed, including: (Vec)HashJoin, (Vec)HashAgg, (Vec) HashSetOp, (Vec)Sort, and (Vec)Materialize operator. The (Vec)HashJoin calculation of width is the width of the right subtree operator, it will be displayed in the right subtree.
E-width
Estimated width of the output tuple of each operator.
E-costs
Estimated execution cost of each operator.
E-costs are defined by the optimizer based on cost parameters, habitually grasping disk page as a unit. Other overhead parameters are set by referring to E-costs.
The cost of each node (the E-costs value) includes the cost of all of its child nodes.
Overhead reflects only what the optimizer is concerned about, but does not consider the time that the result row passed to the client. Although the time may play a very important role in the actual total time, it is ignored by the optimizer, because it cannot be changed by modifying the plan.
SQL Diagnostic Information
SQL self-diagnosis information. Performance optimization points identified during optimization and execution are displayed. When EXPLAIN with the VERBOSE attribute (built-in VERBOSE of EXPLAIN PERFORMANCE) is executed on DML statements, SQL self-diagnosis information is also generated to help locate performance issues.
Predicate Information (identified by plan id)
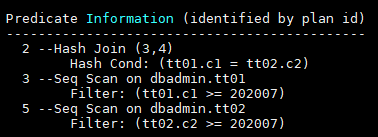
This part displays the filtering conditions of the corresponding execution operator node, that is, the information that does not change during the entire plan execution, mainly the join conditions and filter information.
Memory Information (identified by plan id)
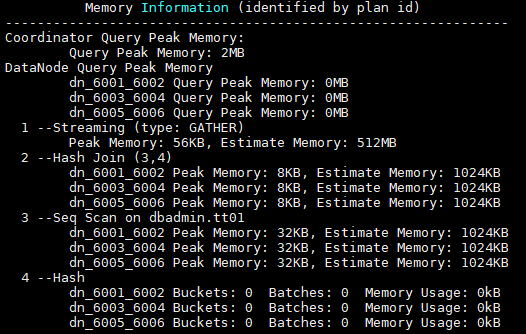
Memory Usage displays the memory usage of operators in the entire plan, mainly Hash and Sort operators, including the peak memory of operators (Peak Memory), memory estimated by the optimizer (Estimate Memory), and control memory (Control Memory), estimated memory usage (operator memory), actual width during execution (Width), number of automatic memory expansion times (Auto Spread Num), whether to spill data to disks in advance (Early Spilled), and spill information which includes the number of repeated data spills (Spill Time(s)), number of internal and foreign table partitions spilled to disks (inner/outer partition spill num), number of files spilled to disks (temp file num), amount of data spilled to disks, and amount of data flushed to the minimum and maximum partitions (written disk IO [min, max]). The Sort operator does not display the number of files written to disks, and displays disks only when displaying sorting methods.
Targetlist Information (identified by plan id)
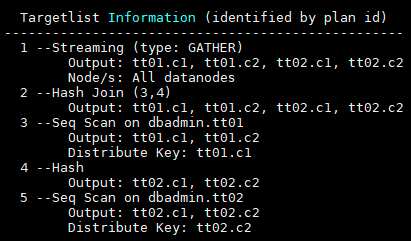
This part displays the output target column information of each operator.
DataNode Information (identified by plan id)
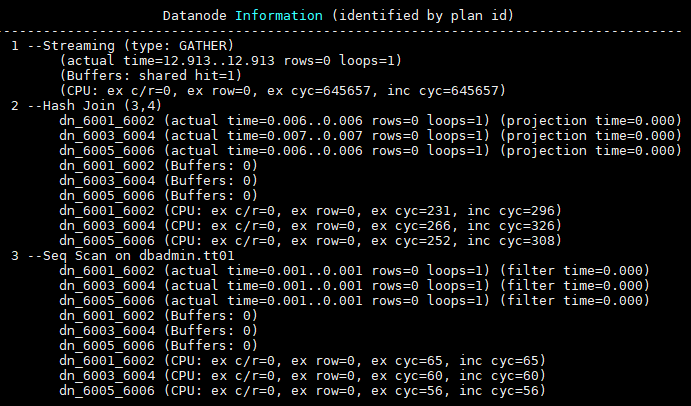
This part displays the execution time of each operator (including the execution time of filtering and projection, if any), CPU usage, and buffer usage.
Operator execution information

The execution information of each operator consists of three parts:
dn_6001_6002/dn_6003_6004 indicates the information about the execution node. The information in the brackets is the actual execution information.
actual time indicates the actual execution time. The first number indicates the duration from the time when the operator is executed to the time when the first data record is output. The second number indicates the total execution time of all data records.
rows indicates the number of output data rows of the operator.
loops indicates the number of execution times of the operator. Note that for a partitioned table, scan on each partition is counted as a scan. Scan on a new partition is counted as a new scan.
CPU information

Each operator execution process has CPU information. cyc indicates the number of CPU cycles, and ex cyc indicates the number of cycles of the current operator, excluding its subnodes. inc cyc indicates the number of cycles, including subnodes, ex row indicates the number of data rows output by the current operator, and ex c/r indicates the mean of ex cyc and ex row.
Buffer information

Buffers indicates the buffer information, including the read and write operations on shared blocks and temporary blocks.
Shared blocks contain tables and indexes, and temporary blocks are disk blocks used in sorting and materialization. The number of blocks displayed on the upper-layer node contains the number of blocks used by all its subnodes.
User Define Profiling

User-defined information, including the time when CNs and DNs are connected, the time when DNs are connected, and some execution information at the storage layer.
Query Summary
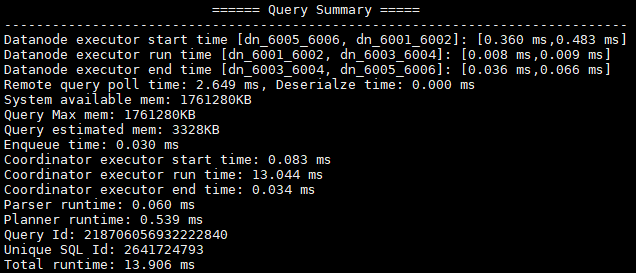
The total execution time and network traffic, including the maximum and minimum execution time in the initialization and end phases on each DN, initialization, execution, and time in the end phase on each CN, and the system available memory during the current statement execution, and statement estimation memory information.
DataNode executor start time: start time of the DN executor. The format is [min_node_name, max_node_name]: [min_time, max_time].
DataNode executor run time: running time of the DN executor. The format is [min_node_name, max_node_name]: [min_time, max_time].
DataNode executor end time: end time of the DN executor. The format is [min_node_name, max_node_name]: [min_time, max_time].
Remote query poll time: poll waiting time for receiving results
System available mem: available system memory
Query Max mem: maximum query memory.
Enqueue time: enqueuing time
Coordinator executor start time: start time of the CN executor
Coordinator executor run time: CN executor running time
Coordinator executor end time: end time of the CN executor
Parser runtime: parser running time
Planner runtime: optimizer execution time
Network traffic, or, the amount of data sent by the stream operator
Query Id: query ID.
Unique SQL ID: constraint SQL ID
Total runtime: total execution time
Important
The difference between A-rows and E-rows shows the deviation between the optimizer estimation and actual execution. Generally, if the deviation is large, the plan generated by the optimizer cannot be trusted, and you need to modify the deviation value.
If the difference of the A-time values is large, it indicates that the operator computing skew (difference between execution time on DNs) is large and that manual performance tuning is required. Generally, for two adjacent operators, the execution time of the upper-layer operator includes that of the lower-layer operator. However, if the upper-layer operator is a stream operator, its execution time may be less than that of the lower-layer operator, as there is no driving relationship between threads.
Max Query Peak Memory is often used to estimate the consumed memory of SQL statements, and is also used as an important basis for setting a memory parameter during SQL statement optimization. Generally, the output from EXPLAIN ANALYZE or EXPLAIN PERFORMANCE is provided for the input for further optimization.