Querying Metrics
Scenario
Cloud Eye monitors the running status of the DIS stream. You can obtain the monitoring metrics of CDM on the Cloud Eye management console.
Monitored data requires a period of time for transmission and display. The status of CDM displayed on the Cloud Eye page is the status obtained 5 to 10 minutes before. You can view the monitored data of a newly created DIS stream 5 to 10 minutes later.
Prerequisites
The DIS stream is running properly.
Note
Cloud Eye will delete a deleted stream from the monitoring list and will not monitor it any more. However, you need to manually clear its alarm rules.
Alarm rules have been configured on the Cloud Eye page. For details, see Setting Alarm Rules.
Procedure
Use the account to log in to the DIS console.
Click
 in the upper left corner of the page and select a region and project.
In the navigation tree on the left, choose Stream Management.
In the stream list, click the name of the DIS stream whose monitoring metrics will be viewed. The monitoring page is displayed.
On the Streams tab page, click View details to switch to the Cloud Eye console.
On the DIS monitoring page, you can view the graphs of all monitoring metrics.
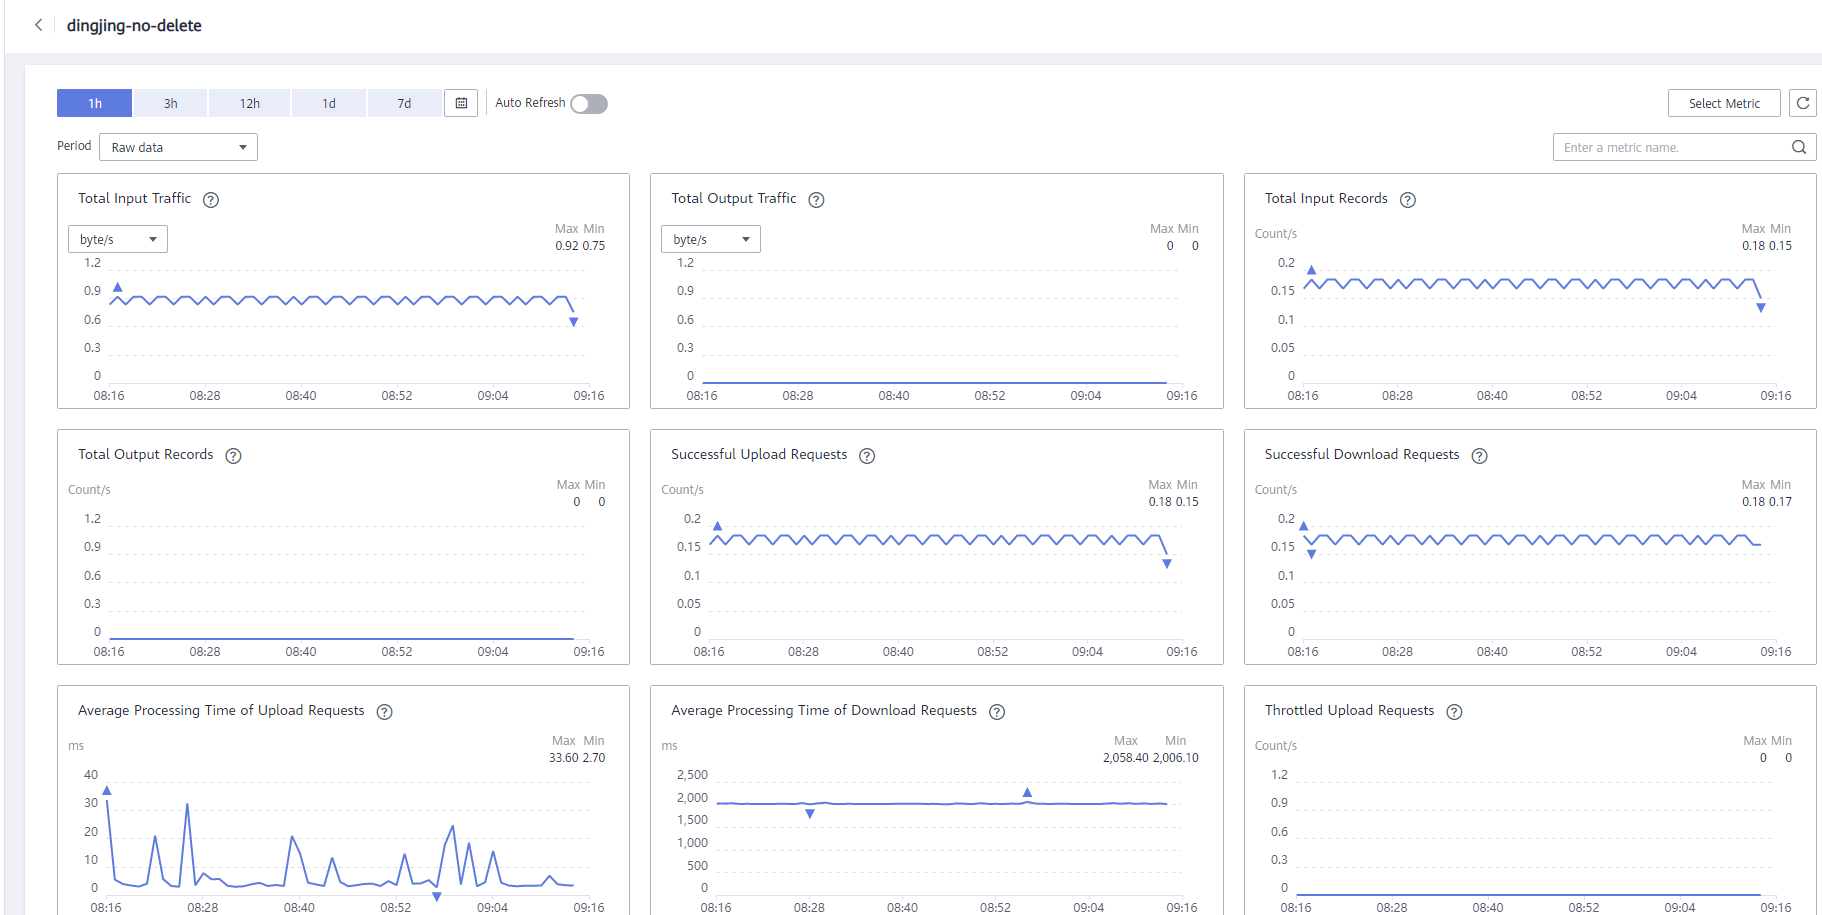
Figure 1 Viewing DIS monitoring metrics
Click
 in the upper right corner of the graphs to zoom out the graphs.
You can view the raw monitoring data curves of different metrics over different periods, such as the last 1 hour, 3 hours, and 12 hours. You can determine whether to enable Auto Refresh. Cloud Eye provides an automatic refresh interval of 60 seconds.