Querying Metrics
Scenario
You can use Cloud Eye to monitor the running status of a CDM cluster. You can view the monitoring metrics on the Cloud Eye console.
Monitored data takes some time for transmission and display. The status displayed on the Cloud Eye console is the status obtained 5 to 10 minutes before. You can view the monitored data of a newly created CDM cluster 5 to 10 minutes later.
Prerequisites
The CDM cluster is running properly.
If a cluster fails to be restarted or is unavailable, its monitoring metrics are unavailable. You can view the monitored data only after the cluster is restarted or recovered.
The cluster has been properly running for about 10 minutes.
The monitored data and graphs are available for a newly created cluster after the cluster runs for at least 10 minutes.
Procedure
Access the CDM console, choose Cluster Management. Locate a cluster, click More in the Operation column, and select View Metric from the drop-down list.
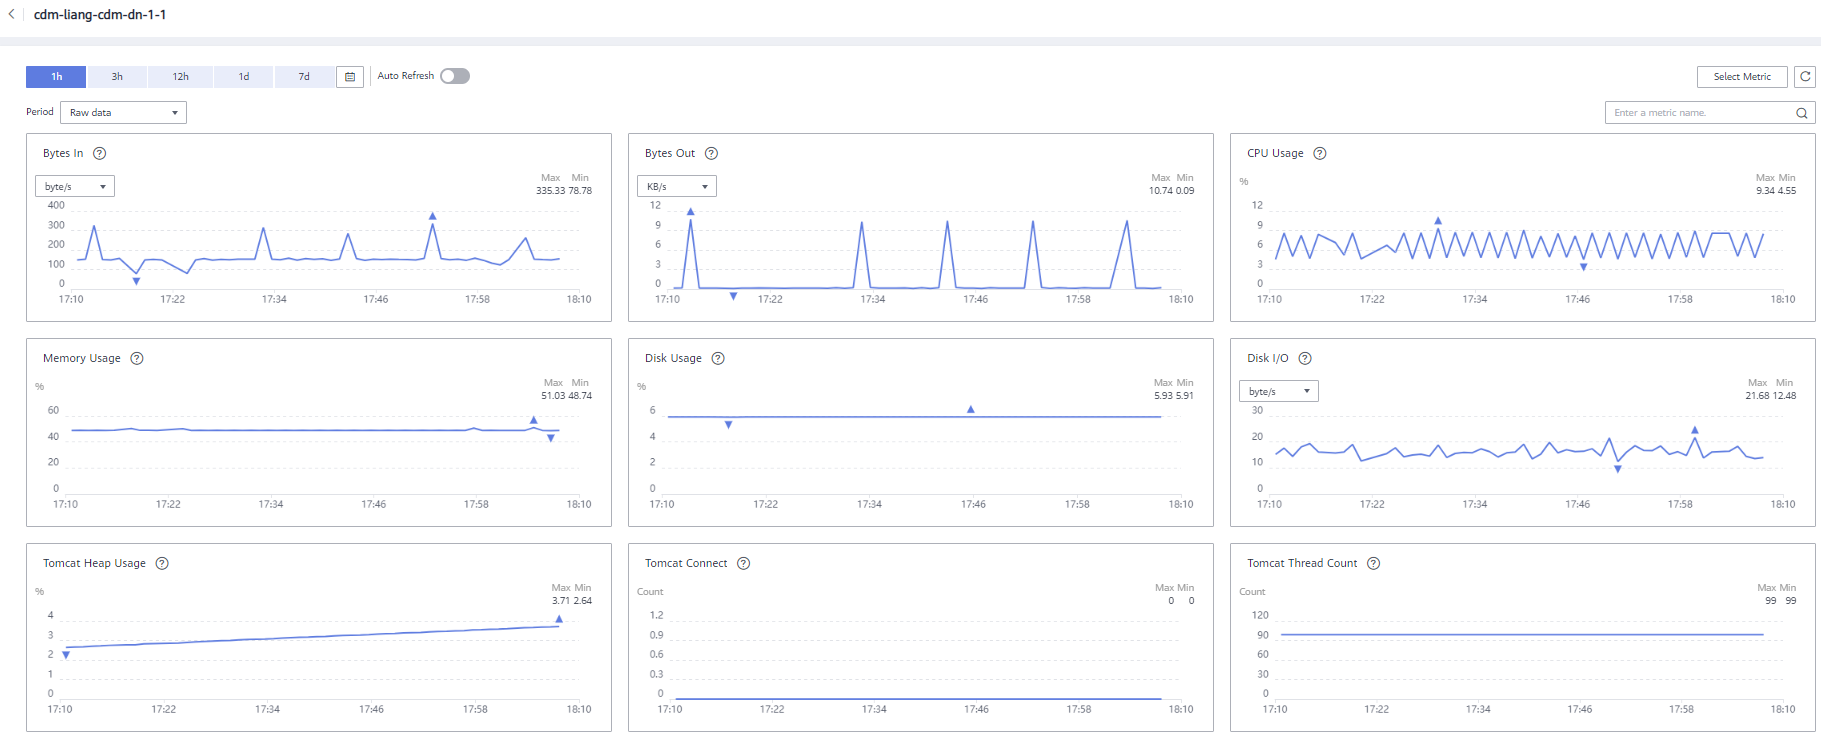
On the CDM monitoring page, you can view the graphs of all monitoring metrics.

Figure 1 Querying Metrics
Click
 in the upper right corner of the graphs to zoom in the graphs.
You can select a time period in the upper left corner to view metric changes in this time period.