Checking Index Monitoring Information
You can check preconfigured index monitoring visualizations on the Dashboard and Visualizations pages of Kibana. You can also customize tables and charts.
Prerequisites
A cluster has been created and index monitoring has been enabled.
Checking Dashboard Charts
Log in to the CSS management console.
Choose Clusters in the navigation pane. On the Clusters page, locate the target cluster, and click Access Kibana in the Operation column.
In the navigation tree on the left, click Dashboard.
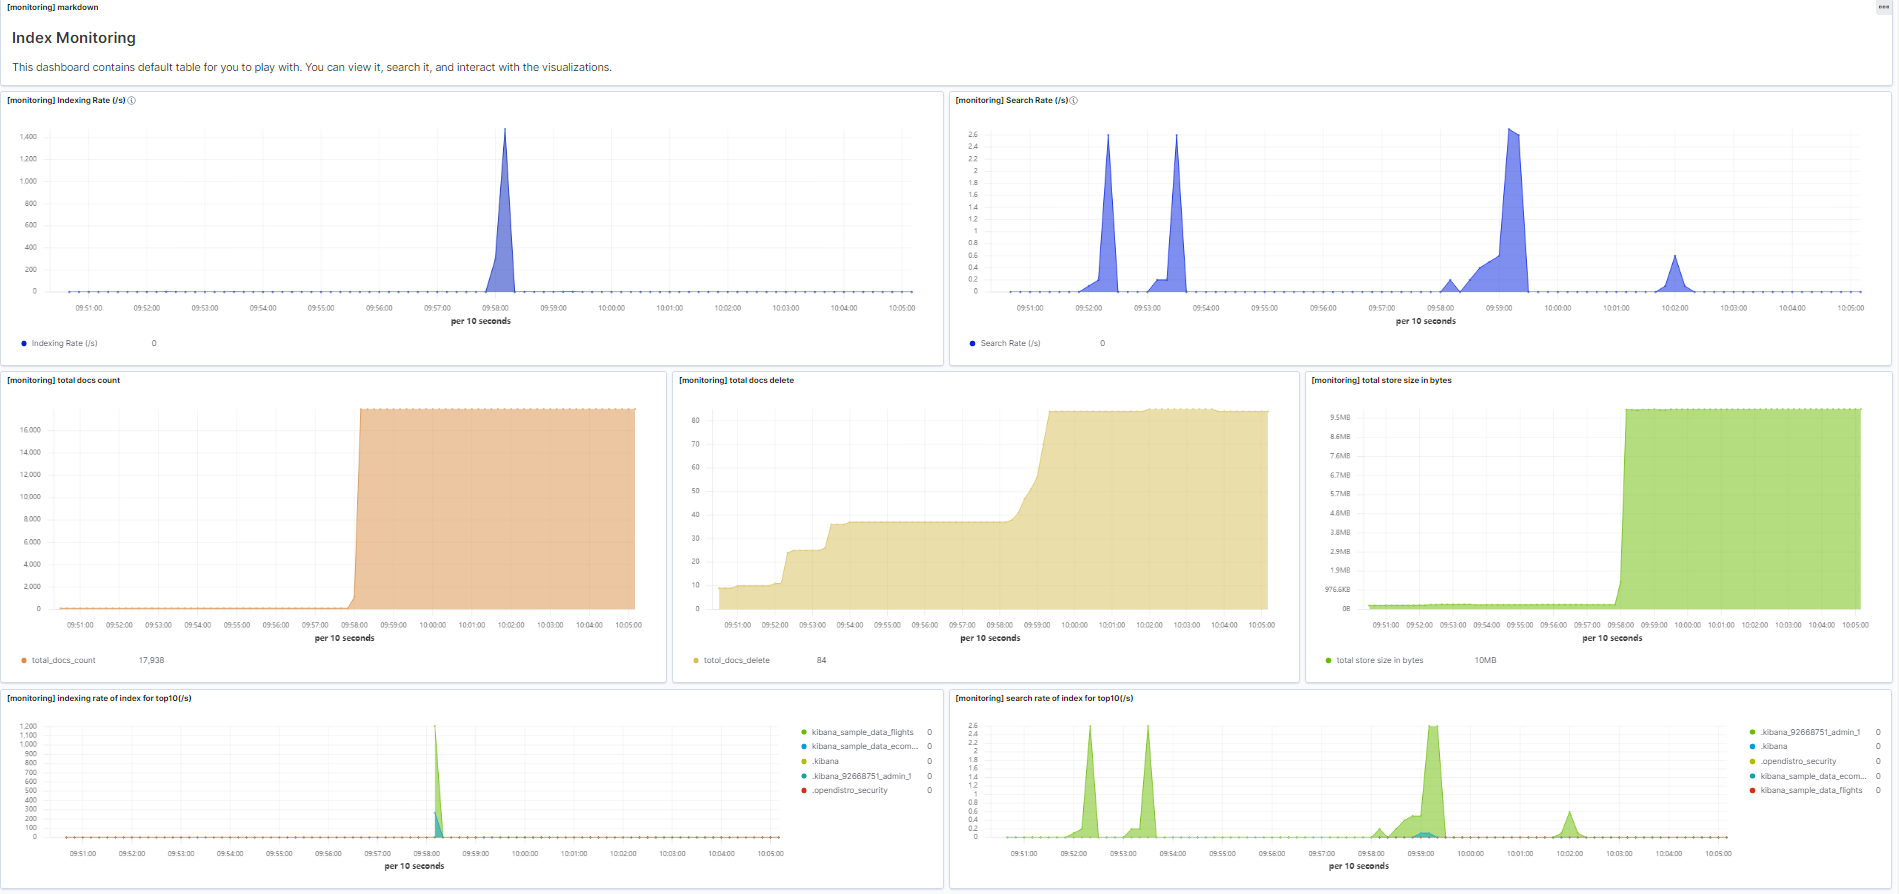
Click [Monitoring] Index Monitoring Dashboard to view the preconfigured dashboard.

Figure 1 Preconfigured dashboard charts
The preconfigured dashboard displays the number of read and write operations per second in the cluster and the top 10 indexes with the most read and write operations per second.
Table 1 Preconfigured charts¶ Chart Name
Description
[monitoring] markdown
Markdown chart, which briefly describes the dashboard content.
[monitoring] Indexing Rate (/s)
Number of documents written to a cluster per second.
[monitoring] Search Rate (/s)
Average number of queries per second in a cluster.
[monitoring] indexing rate of index for top10
Top 10 indexes with the most documents written per second.
[monitoring] search rate of index for top10
Top 10 indexes with the most queries per second.
[monitoring] total docs count
Total number of documents in a cluster.
[monitoring] total docs delete
Total number of deleted documents in a cluster.
[monitoring] total store size in bytes
Total storage occupied by documents in a cluster.
[monitoring] indices store_size for top10
Top 10 indexes that occupy the largest storage space.
[monitoring] indices docs_count for top10
Top 10 indexes with the largest number of documents.
[monitoring] indexing time in millis of index for top10(ms)
Top 10 indexes with the longest document write latency in a unit time (ms).
[monitoring] search query time in millis of index for top10(ms)
Top 10 indexes with the longest index query time in a unit time (ms).
[monitoring] segment count of index for top10
Top 10 indexes with the largest number of index segments.
[monitoring] segment memory in bytes of index for top10
Top 10 indexes with the largest heap memory usage of index segments.
Important
The index pattern of monitoring-eye-css-* cannot be deleted during index monitoring. Otherwise, the monitoring chart will be abnormal.
Customizing Visualizations Charts
The index monitoring module periodically stores the index/stats information in the monitoring-eys-css index. You can use the Kibana chart function to draw customized charts.
The following procedure describes how to check the trend of the document quantity in a chart as an example.
Log in to the CSS management console.
Choose Clusters in the navigation pane. On the Clusters page, locate the target cluster and click Access Kibana in the Operation column.
Choose Visualize.
Click Create visualization and select TSVB.
Set chart parameters and view the visualizations.
On the Data tab page, index_stats.primaries.docs.count indicates the number of documents in the primary shard. Derivative indicates the difference between aggregation buckets. Set Unit to 1s, visualizing network rates as "per second". Select Positive only to prevent negative numbers after resetting. To sort statistics by index, set Group by to Terms and By to index_stats.index. Statistics will be grouped by index name.

Figure 2 TSVB page
To view data in different time segments, set the aggregation interval, or the displayed data will be incomplete. On the Panel options tab page, set Interval to 1m or 30m to adjust the interval of timestamp.

Figure 3 Setting the interval
Importing Index Monitoring Charts
You can import or export charts on Kibana. If the index monitoring charts are not displayed, you can import the charts to Kibana again to load the monitoring view.
The following describes how to import a chart to Kibana:
Create the monitoring-kibana.ndjson file by referring to kibana-monitor.
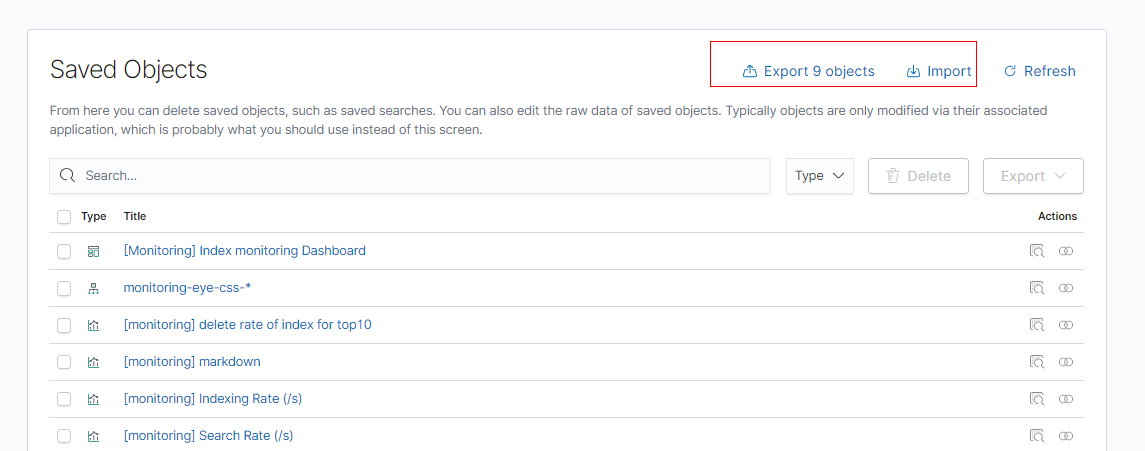
Log in to Kibana and choose Management > Stack Management > Saved objects.

Figure 4 Selecting saved objects
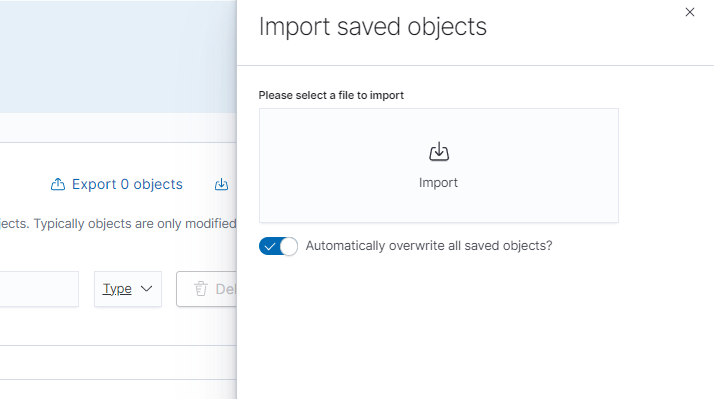
Click Import and upload the monitoring-kibana.ndjson file created in step 1.

Figure 5 Uploading a file
After the upload is complete, click Done. The index monitoring chart is successfully imported.

Figure 6 Successfully importing index monitoring charts