Configuring SMN Alarms
Scenario Description
By default, the open-source OpenDistro alarm plugin (opendistro_alerting) is integrated into CSS to send notifications when data meets specific conditions. This plugin consists of three components: Dashboard, Monitors, and Destinations. CSS integrates the SMN service in the Destinations component and can send alarm messages only through the SMN service as the destination.
This section describes how to use the OpenDistro alarm plugin to configure SMN alarms for Elasticsearch clusters in Kibana.
Note
For details about the official guide of the open-source alarm plug-in Opendistro Alerting, visit OpenDistro-Monitors.
Constraints and Limitations
The open-source OpenDistro alarm plugin is installed on Elasticsearch clusters of the versions 7.1.1, 7.6.2, and 7.10.2 by default.
Prerequisites
The SMN service has been authorized. For details, see (Optional) Authorizing CSS to Use SMN.
You have created a topic on the SMN console.
Procedure
Log in to the CSS management console.
On the Cluster Management > Elasticsearch page, select the target cluster and click Access Kibana in the Operation column.
On the Kibana page, choose Open Distro for Elasticsearch > Alerting in the navigation pane on the left.
Create an SMN destination to send alert messages.
On the Alerting page, click the Destinations tab and click Add destination to configure destination information.
Table 1 Destinations parameter description¶ Parameter
Description
Name
User-defined destination name
Type
Retain the default value SMN.
Topic
Select the SMN topic you have created for sending alarm messages.
Note
For the Elasticsearch cluster of version 7.1.1, you need to manually enter the topic name. Ensure that the topic name is the same as that in the SMN service.
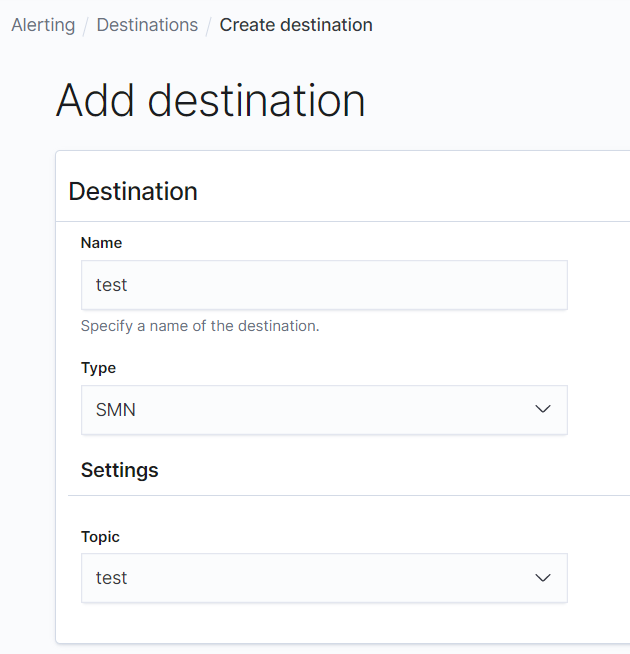
Figure 1 Add destination
Click Create to return to the destination list. If the created SMN destination is displayed in the list, the creation is complete.
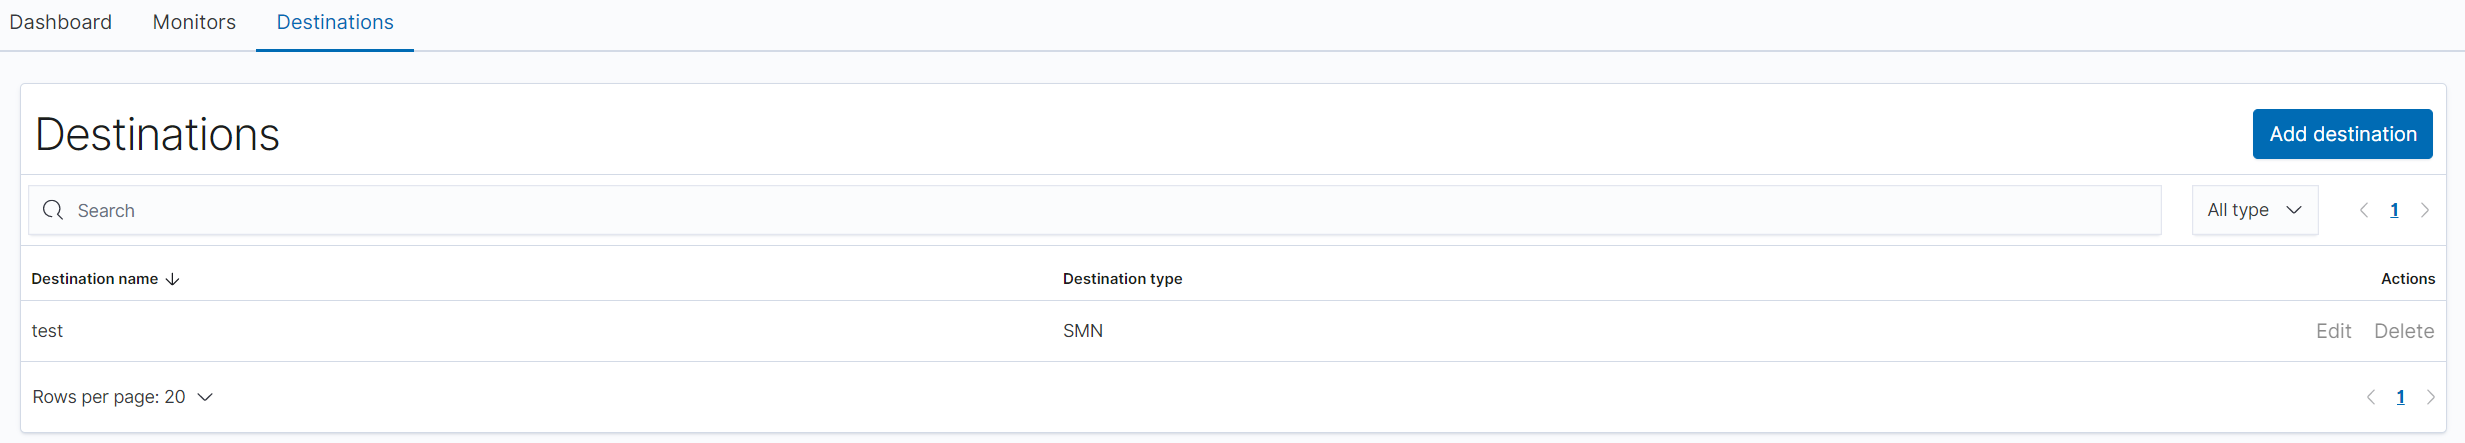
Figure 2 Destination list
Create a monitoring task and configure the alarm triggering condition and monitoring frequency.
Click the Monitors tab on the Alerting page and click Create monitors to configure monitoring information.
Table 2 Monitor parameters¶ Parameter
Description
Monitor name
User-defined monitor name
Monitor state
Monitoring status. You are advised to keep this function enabled.
Method of definition
Select a method to define monitoring. You are advised to use Define using extraction query.
Define using visual graph: use visualized query statement
Define using extraction query: use specific query statement
Index
Index to be monitored
Time field
When Define using visual graph is selected, select a time field and define counting parameters such as count.
Frequency
Select the monitoring frequency and set the monitoring interval. The options include:
By interval
Daily
Weekly
Monthly
Custom cron expression
Click Create. The Create trigger page is displayed.
On the Create trigger page, set the alarm triggering conditions and actions to be triggered.
Table 3 Trigger parameters¶ Parameter
Description
Trigger name
User-defined trigger name
Severity level
Sensitivity of a trigger, that is, the number of alarms that are triggered before an alarm message is sent. 1 indicates the highest sensitivity.
Trigger condition
Trigger condition. An alarm is triggered when the trigger condition is hit.
Action name
Name of a trigger action
Destination
Select the SMN destination created in section 4.
Message subject
Title of the alarm message. This parameter is required only when Elasticsearch clusters of version 7.10.2 is used.
Message
Body of an alarm message. By default, the subject and body are defined when the destination is an email.
Action throttling
Message sending frequency. It limits the number of notification messages can be received in a specified period.
For example, if this parameter is set to 10 minutes, SMN sends only one alarm notification in the next 10 minutes even if the trigger condition is hit for multiple times. After 10 minutes, SMN sends another alarm notification if the alarm condition is met.
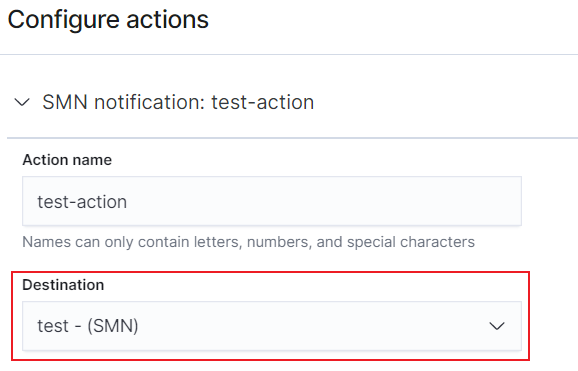
Figure 3 Setting the destination of a trigger action
Click Send test message. If a subscriber receives an email, as shown in Figure 5, the trigger is configured successfully.
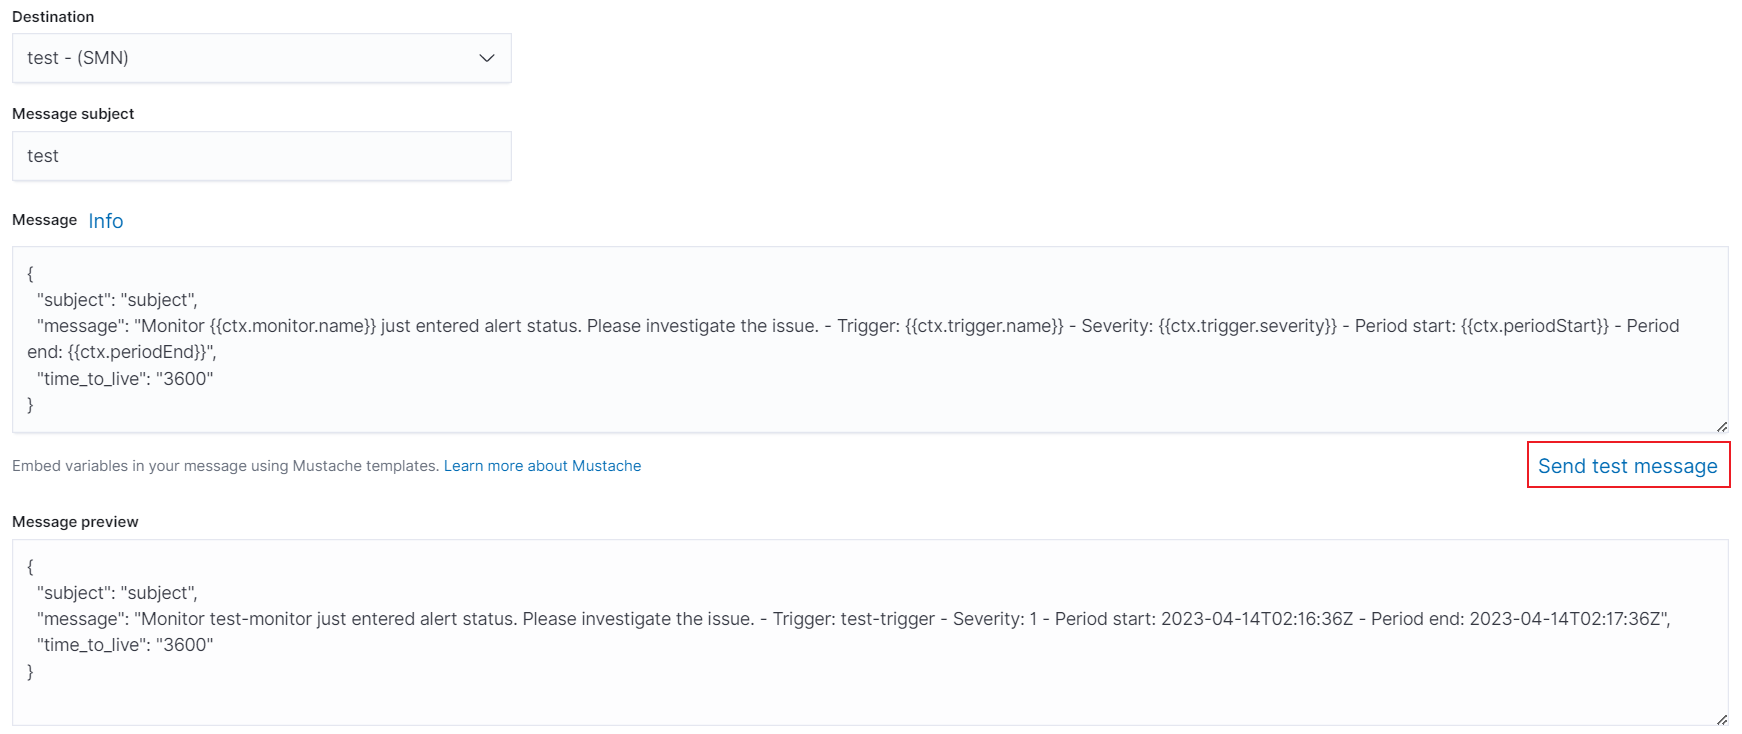
Figure 4 Sending test messages
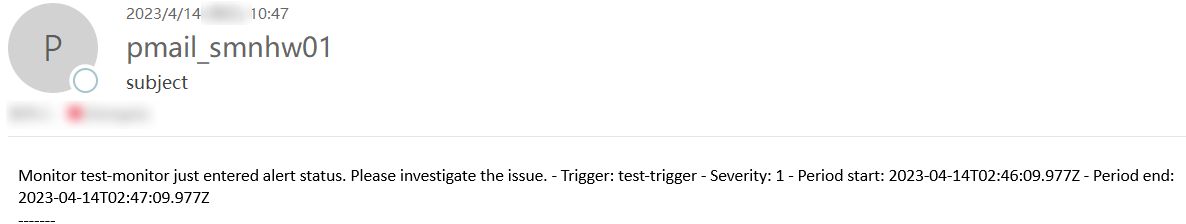
Figure 5 Email notification
Click Create to return to the Monitor details page.