Using Logstash to Import Data to Elasticsearch
You can use Logstash to collect data and migrate collected data to Elasticsearch in CSS. This method helps you effectively obtain and manage data through Elasticsearch. Data files can be in the JSON or CSV format.
Logstash is an open-source, server-side data processing pipeline that ingests data from multiple sources simultaneously, transforms data, and then sends data to Elasticsearch. For details about Logstash, visit the following website: https://www.elastic.co/guide/en/logstash/current/getting-started-with-logstash.html
The following two scenarios are involved depending on the Logstash deployment:
Prerequisites
To facilitate operations, you are advised to deploy Logstash on a host that runs the Linux operating system (OS).
To download Logstash, visit the following website: https://www.elastic.co/downloads/logstash-oss
Note
Logstash requires an OSS version same as the CSS version.
After installing Logstash, perform the following steps to import data. For details about how to install Logstash, visit the following website: https://www.elastic.co/guide/en/logstash/current/installing-logstash.html
The JDK must be installed before Logstash is installed. In Linux OS, you can run the yum -y install java-1.8.0 command to install JDK 1.8.0. In Windows OS, you can download the required JDK version from the official website of JDK, and install it by following the installation guide.
In the Importing Data When Logstash Is Deployed on an ECS scenario, ensure that the ECS and the Elasticsearch cluster to which data is imported reside in the same VPC.
Importing Data When Logstash Is Deployed on the External Network
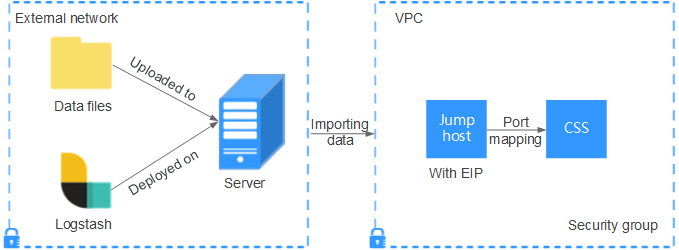
Figure 1 illustrates how data is imported when Logstash is deployed on an external network.

Figure 1 Importing data when Logstash is deployed on an external network
Create a jump host and configure it as follows:
The jump host is an ECS running the Linux OS and has been bound with an EIP.
The jump host resides in the same VPC as the CSS cluster.
SSH local port forwarding is configured for the jump host to forward requests from a chosen local port to port 9200 on one node of the CSS cluster.
Refer to SSH documentation for the local port forwarding configuration.
Use PuTTY to log in to the created jump host with the EIP.
Run the following command to perform port mapping and transfer the request sent to the port on the jump host to the target cluster:
ssh -g -L <Local port of the jump host:Private network address and port number of a node> -N -f root@<Private IP address of the jump host>
Note
In the preceding command, <Local port of the jump host> refers to the port obtained in 1.
In the preceding command, <Private network address and port number of a node> refers to the private network address and port number of a node in the cluster. If the node is faulty, the command execution will fail. If the cluster contains multiple nodes, you can replace the value of <private network address and port number of a node> with the private network address and port number of any available node in the cluster. If the cluster contains only one node, restore the node and execute the command again.
Replace <Private IP address of the jump host> in the preceding command with the IP address (with Private IP) of the created jump host in the IP Address column in the ECS list on the ECS management console.
For example, port 9200 on the jump host is assigned external network access permissions, the private network address and port number of the node are 192.168.0.81 and 9200, respectively, and the private IP address of the jump host is 192.168.0.227. You need to run the following command to perform port mapping:
ssh -g -L 9200:192.168.0.81:9200 -N -f root@192.168.0.227
Log in to the server where Logstash is deployed and store the data files to be imported on the server.
For example, data file access_20181029_log needs to be imported, the file storage path is /tmp/access_log/, and the data file includes the following data:
Note
Create the access_log folder if it does not exist.
|   All |               Heap used for segments |                        |     18.6403 |      MB |
|   All |             Heap used for doc values |                        |    0.119289 |      MB |
|   All |                  Heap used for terms |                        |     17.4095 |      MB |
|   All |                  Heap used for norms |                        |   0.0767822 |      MB |
|   All |                 Heap used for points |                        |    0.225246 |      MB |
|   All |          Heap used for stored fields |                        |    0.809448 |      MB |
|   All |                        Segment count |                        |         101 |         |
|   All |                       Min Throughput |           index-append |     66232.6 |  docs/s |
|   All |                    Median Throughput |           index-append |     66735.3 |  docs/s |
|   All |                       Max Throughput |           index-append |     67745.6 |  docs/s |
|   All |              50th percentile latency |           index-append |     510.261 |      ms |
In the server where Logstash is deployed, run the following command to create configuration file logstash-simple.conf in the Logstash installation directory:
cd /<Logstash installation directory>/
vi logstash-simple.conf
Input the following content in logstash-simple.conf:
input {
Location of data
}
filter {
Related data processing
}
output {
    elasticsearch {
        hosts => "<EIP of the jump host>:<Number of the port assigned external network access permissions on the jump host>"
        (Optional) If communication encryption has been enabled on the cluster, you need to add the following configuration:
        ssl => true
        ssl_certificate_verification => false
    }
}
The input parameter indicates the data source. Set this parameter based on the actual conditions. For details about the input parameter and parameter usage, visit the following website: https://www.elastic.co/guide/en/logstash/current/input-plugins.html
The filter parameter specifies the mode in which data is processed. For example, extract and process logs to convert unstructured information into structured information. For details about the filter parameter and parameter usage, visit the following website: https://www.elastic.co/guide/en/logstash/current/filter-plugins.html
The output parameter indicates the destination address of the data. For details about the output parameter and parameter usage, visit https://www.elastic.co/guide/en/logstash/current/output-plugins.html. Replace <EIP address of the jump host> with the IP address (with EIP) of the created jump host in the IP Address column in the ECS list on the ECS management console. <Number of the port assigned external network access permissions on the jump host> is the number of the port obtained in 1, for example, 9200.
Consider the data files in the /tmp/access_log/ path mentioned in 4 as an example. Assume that data import starts from data in the first row of the data file, the filtering condition is left unspecified (indicating no data processing operations are performed), the public IP address and port number of the jump host are 192.168.0.227 and 9200, respectively, and the name of the target index is myindex. Edit the configuration file as follows, and enter :wq to save the configuration file and exit.
input {
    file{
      path => "/tmp/access_log/*"
      start_position => "beginning"
    }
}
filter {
}
output {
    elasticsearch {
      hosts => "192.168.0.227:9200"
      index => "myindex"

    }
}
Note
If a license error is reported, set ilm_enabled to false.
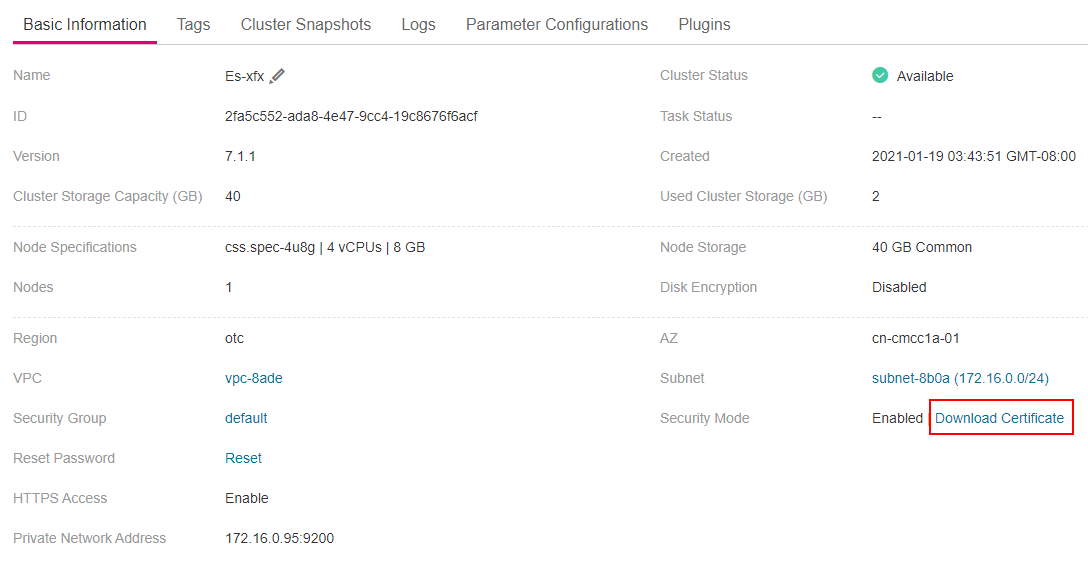
If the cluster has the security mode enabled, you need to download a certificate first.
Download a certificate on the Basic Information page of the cluster.

Figure 2 Downloading a certificate
Store the certificate to the server where Logstash is deployed.
Modify the logstash-simple.conf configuration file.
Consider the data files in the /tmp/access_log/ path mentioned in 4 as an example. Assume that data import starts from data in the first row of the data file, the filtering condition is left unspecified (indicating no data processing operations are performed), and the public IP address and port number of the jump host are 192.168.0.227 and 9200, respectively. The name of the index for importing data is myindex, and the certificate is stored in /logstash/logstash6.8/config/CloudSearchService.cer. Edit the configuration file as follows, and enter :wq to save the configuration file and exit.
input{
    file {
        path => "/tmp/access_log/*"
        start_position => "beginning"
    }
}
filter {
    }
output{
    elasticsearch{
        hosts => ["https://192.168.0.227:9200"]
        index => "myindex"
        user => "admin"
        password => "******"
        cacert => "/logstash/logstash6.8/config/CloudSearchService.cer"
        manager_template => false
        ilm_enabled => false
        ssl => true
        ssl_certificate_verification => false
    }
}
Note
password: password for logging in to the cluster
Run the following command to import the data collected by Logstash to the cluster:
./bin/logstash -f logstash-simple.conf
Note
This command must be executed in the directory where the logstash-simple.conf file is stored. For example, if the logstash-simple.conf file is stored in /root/logstash-7.1.1/, go to the directory before running the command.
Log in to the CSS management console.
In the navigation pane on the left, choose Clusters > Elasticsearch to switch to the Clusters page.
From the cluster list, locate the row that contains the cluster to which you want to import data and click Access Kibana in the Operation column.
In the Kibana navigation pane on the left, choose Dev Tools.
On the Console page of Kibana, search for the imported data.
On the Console page of Kibana, run the following command to search for data. View the search results. If the searched data is consistent with the imported data, the data has been imported successfully.
GET myindex/_search
Importing Data When Logstash Is Deployed on an ECS
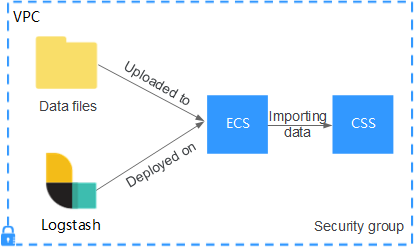
Figure 3 illustrates how data is imported when Logstash is deployed on an ECS that resides in the same VPC as the cluster to which data is to be imported.

Figure 3 Importing data when Logstash is deployed on an ECS
Ensure that the ECS where Logstash is deployed and the cluster to which data is to be imported reside in the same VPC, port 9200 of the ECS security group has been assigned external network access permissions, and an EIP has been bound to the ECS.
Note
If there are multiple servers in a VPC, you do not need to associate EIPs to other servers as long as one server is associated with an EIP. Switch to the node where Logstash is deployed from the node with which the EIP is associated.
If a private line or VPN is available, you do not need to associate an EIP.
Use PuTTY to log in to the ECS.
For example, data file access_20181029_log is stored in the /tmp/access_log/ path of the ECS, and the data file includes the following data:
|   All |               Heap used for segments |                        |     18.6403 |      MB |
|   All |             Heap used for doc values |                        |    0.119289 |      MB |
|   All |                  Heap used for terms |                        |     17.4095 |      MB |
|   All |                  Heap used for norms |                        |   0.0767822 |      MB |
|   All |                 Heap used for points |                        |    0.225246 |      MB |
|   All |          Heap used for stored fields |                        |    0.809448 |      MB |
|   All |                        Segment count |                        |         101 |         |
|   All |                       Min Throughput |           index-append |     66232.6 |  docs/s |
|   All |                    Median Throughput |           index-append |     66735.3 |  docs/s |
|   All |                       Max Throughput |           index-append |     67745.6 |  docs/s |
|   All |              50th percentile latency |           index-append |     510.261 |      ms |
Run the following command to create configuration file logstash-simple.conf in the Logstash installation directory:
cd /<Logstash installation directory>/
vi logstash-simple.conf
Input the following content in logstash-simple.conf:
input {
Location of data
}
filter {
Related data processing
}
output {
    elasticsearch{
        hosts => "<Private network address and port number of the node>"}
        (Optional) If communication encryption has been enabled on the cluster, you need to add the following configuration:
        ssl => true
        ssl_certificate_verification => false
}
The input parameter indicates the data source. Set this parameter based on the actual conditions. For details about the input parameter and parameter usage, visit the following website: https://www.elastic.co/guide/en/logstash/current/input-plugins.html
The filter parameter specifies the mode in which data is processed. For example, extract and process logs to convert unstructured information into structured information. For details about the filter parameter and parameter usage, visit the following website: https://www.elastic.co/guide/en/logstash/current/filter-plugins.html
The output parameter indicates the destination address of the data. For details about the output parameter and parameter usage, visit https://www.elastic.co/guide/en/logstash/current/output-plugins.html. <private network address and port number of a node> refers to the private network address and port number of a node in the cluster.
If the cluster contains multiple nodes, you are advised to replace the value of <Private network address and port number of a node> with the private network addresses and port numbers of all nodes in the cluster to prevent node faults. Use commas (,) to separate the nodes' private network addresses and port numbers. The following is an example:
hosts => ["192.168.0.81:9200","192.168.0.24:9200"]
If the cluster contains only one node, the format is as follows:
hosts => "192.168.0.81:9200"
Consider the data files in the /tmp/access_log/ path mentioned in 2 as an example. Assume that data import starts from data in the first row of the data file, the filtering condition is left unspecified (indicating no data processing operations are performed), the private network address and port number of the node in the cluster where data is to be imported are 192.168.0.81 and 9200, respectively, and the name of the target index is myindex. Edit the configuration file as follows, and enter :wq to save the configuration file and exit.
input {
    file{
      path => "/tmp/access_log/*"
      start_position => "beginning"
    }
}
filter {
}
output {
    elasticsearch {
      hosts => "192.168.0.81:9200"
      index => "myindex"

    }
}
If the cluster has the security mode enabled, you need to download a certificate first.
Download a certificate on the Basic Information page of the cluster.

Figure 4 Downloading a certificate
Store the certificate to the server where Logstash is deployed.
Modify the logstash-simple.conf configuration file.
Consider the data files in the /tmp/access_log/ path mentioned in step 2 as an example. Assume that data import starts from data in the first row of the data file, the filtering condition is left unspecified (indicating no data processing operations are performed), the public IP address and port number of the jump host are 192.168.0.227 and 9200, respectively. The name of the index for importing data is myindex, and the certificate is stored in /logstash/logstash6.8/config/CloudSearchService.cer. Edit the configuration file as follows, and enter :wq to save the configuration file and exit.
input{
    file {
        path => "/tmp/access_log/*"
        start_position => "beginning"
    }
}
filter {
    }
output{
    elasticsearch{
        hosts => ["https://192.168.0.227:9200"]
        index => "myindex"
        user => "admin"
        password => "******"
        cacert => "/logstash/logstash6.8/config/CloudSearchService.cer"
        manager_template => false
        ilm_enabled => false
        ssl => true
        ssl_certificate_verification => false
    }
}
Note
password: password for logging in to the cluster
Run the following command to import the ECS data collected by Logstash to the cluster:
./bin/logstash -f logstash-simple.conf
Log in to the CSS management console.
In the navigation pane on the left, choose Clusters > Elasticsearch to switch to the Clusters page.
From the cluster list, locate the row that contains the cluster to which you want to import data and click Access Kibana in the Operation column.
In the Kibana navigation pane on the left, choose Dev Tools.
On the Console page of Kibana, search for the imported data.
On the Console page of Kibana, run the following command to search for data. View the search results. If the searched data is consistent with the imported data, the data has been imported successfully.
GET myindex/_search