What Can I Do If My Cluster Status Is Available but the Node Status Is Unavailable?
If the cluster status is available but some nodes in the cluster are unavailable, perform the following operations to rectify the fault:
Fault Locating
Check Item 1: Whether the Node Is Overloaded
Fault locating:
Log in to the CCE console. In the navigation pane, choose Resource Management > Nodes.
Click the name of an unavailable node to go to the node details page.
On the Monitoring tab page, click View Monitoring Details to go to the AOM console and view historical monitoring records.
A too high CPU or memory usage of the node will result in an excessive network latency or trigger system OOM (see What Should I Do If the OOM Killer Is Triggered When a Container Uses Memory Resources More Than Limited?). Therefore, the node is displayed as unavailable.
Solution
You are advised to migrate services to reduce the workloads on the node and set the resource upper limit for the workloads.
You can also restart the node on the ECS console.
After the node becomes available, the workload is restored.
Check Item 2: Whether the ECS Is Deleted or Faulty
Check whether the cluster is available.
Log in to the CCE console, choose Resource Management > Clusters in the navigation pane. On the page displayed, check whether the cluster is available.
If the cluster is unavailable, contact technical support to rectify the fault.
If the cluster is available but some nodes in the cluster are unavailable, go to 2.
Log in to the ECS console. In the navigation pane, choose Elastic Cloud Server to view the ECS status.
If the ECS status is Deleted, go back to the CCE console, choose Resource Management > Nodes in the navigation pane, delete the corresponding node, and then create another one.
If the ECS status is Stopped or Frozen, restore the ECS first. It takes about 3 minutes to restore the ECS.
If the ECS status is Faulty, restart the ECS. If the ECS is still faulty, contact technical support to rectify the fault.
If the ECS status is Running, log in to the ECS to locate the fault according to Check Item 6: Whether Internal Components Are Normal.
Check Item 3: Whether You Can Log In to the ECS
Log in to the management console. Choose Service List > Computing > Elastic Cloud Server.
In the ECS list, locate the newly created node (generally named in the format of cluster name
-random number) in the cluster and click Remote Login in the Operation column.Check whether the node name displayed on the page is the same as that on the VM and whether the password or key can be used to log in to the node.
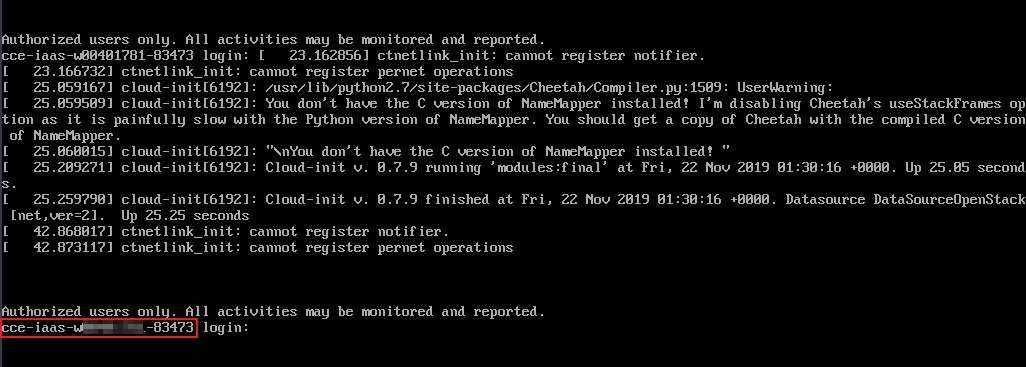
Figure 1 Check the node name on the VM and whether the node can be logged in to
If the node names are inconsistent and the password and key cannot be used to log in to the node, Cloud-Init problems occurred when an ECS was created. In this case, restart the node and submit a service ticket to the ECS personnel to locate the root cause.
Check Item 4: Whether the Security Group Is Modified
Log in to the management console, and choose Service List > Network > Virtual Private Cloud. In the navigation pane, choose Access Control > Security Groups, and locate the security group of the master node.
The name of this security group is in the format of cluster name-cce-control-ID.
Click the security group. On the details page displayed, ensure that the security group rules of the master node are the same as those in the following figure.
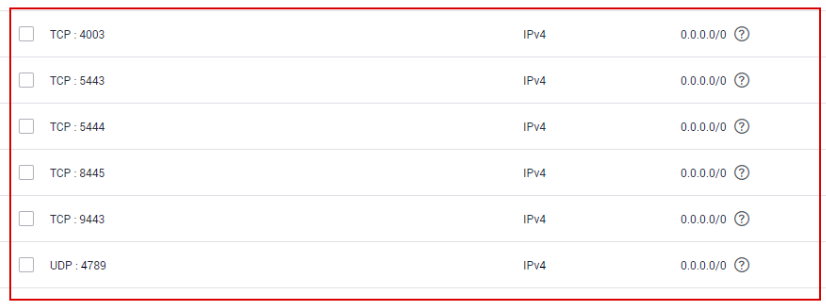
Figure 2 Viewing inbound rules of the security group
Inbound rule parameter description:
4789: used for network access between containers.
5443-5444: used by kubelet of the node to listen to kube-api of the master node.
9443: used by canal of the node to listen to canal-api of the master node.
8445: used by storage_driver of the node to access csms-storagemgr of the master node.

Figure 3 Viewing outbound rules of the security group
Check Item 5: Whether the Disk Is Abnormal
After a node is created in a cluster of v1.7.3-r7 or a later version, a 100 GB data disk dedicated for Docker is bound to the node. If the data disk is uninstalled or damaged, the Docker service becomes abnormal and the node becomes unavailable.
Click the node name to check whether the data disk mounted to the node is uninstalled. If the disk is uninstalled, mount a data disk to the node again and restart the node. Then the node can be recovered.
Check Item 6: Whether Internal Components Are Normal
Log in to the ECS where the unavailable node is located.
For details, see Logging In to a Linux ECS.
Run the following command to check whether the PaaS components are normal:
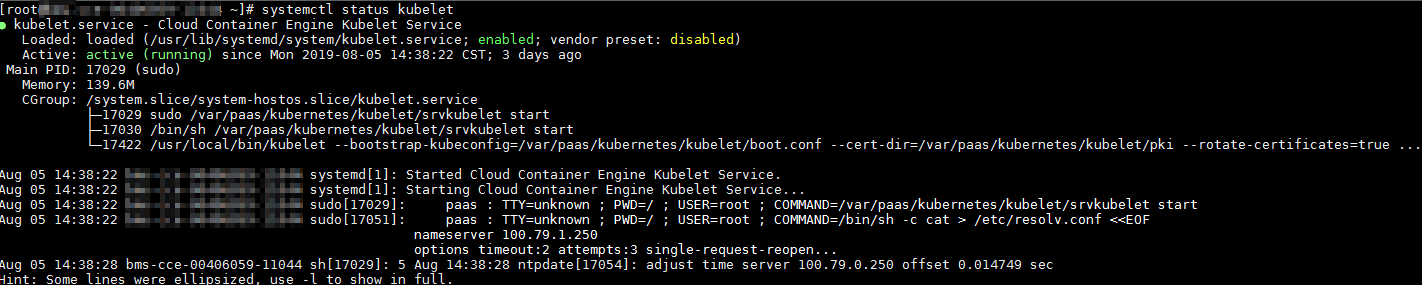
For version 1.13, run the following command:
systemctl status kubelet
If this command fails to be run, contact technical support. If this command is successfully executed, the status of each component is displayed as active, as shown in the following figure.
If the component status is not active, run the following commands (using the faulty component canal as an example):
Run systemctl restart canal to restart the component.
After restarting the component, run systemctl status canal to check the status.
For versions earlier than v1.13, run the following command:
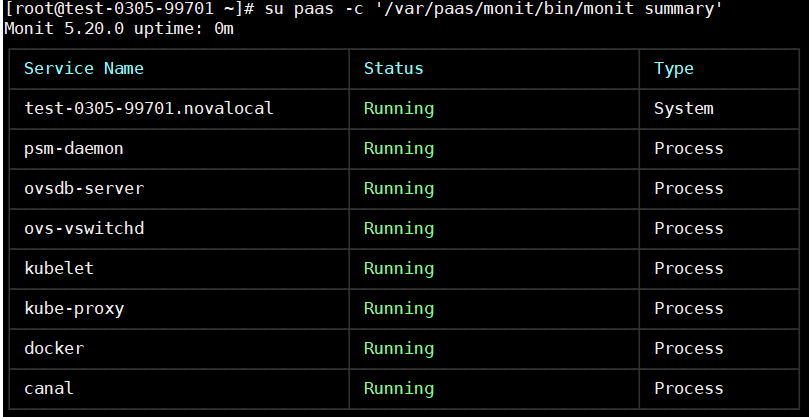
su paas -c '/var/paas/monit/bin/monit summary'
If this command fails to be run, contact technical support. If this command is successfully executed, the status of each component is displayed, as shown in the following figure.
If any service component is not in the Running state, restart the corresponding service. For example, the canal component is abnormal, as shown in the following figure.

Run su paas -c '/var/paas/monit/bin/monit restart canal' to restart the canal component.
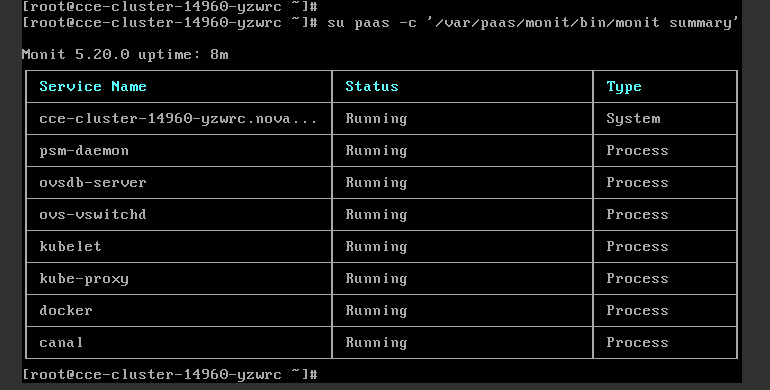
After the restart, run su paas -c '/var/paas/monit/bin/monit summary' to query the status of the canal component.
In that case, the status of each component is Running, as shown in the following figure.
If the restart command fails to be run, run the following command to check the running status of the monitrc process:
ps -ef | grep monitrc
If the monitrc process exists, run the following command to kill this process. The monitrc process will be automatically restarted after it is killed.
kill -s 9 `ps -ef | grep monitrc | grep -v grep | awk '{print $2}'`
If the monitrc process does not exist or is not restarted after being killed, contact technical support.
If the fault persists, collect logs in the /var/log/message and /var/paas/sys/log directories, submit a service ticket, and contact technical support.