Custom Monitoring
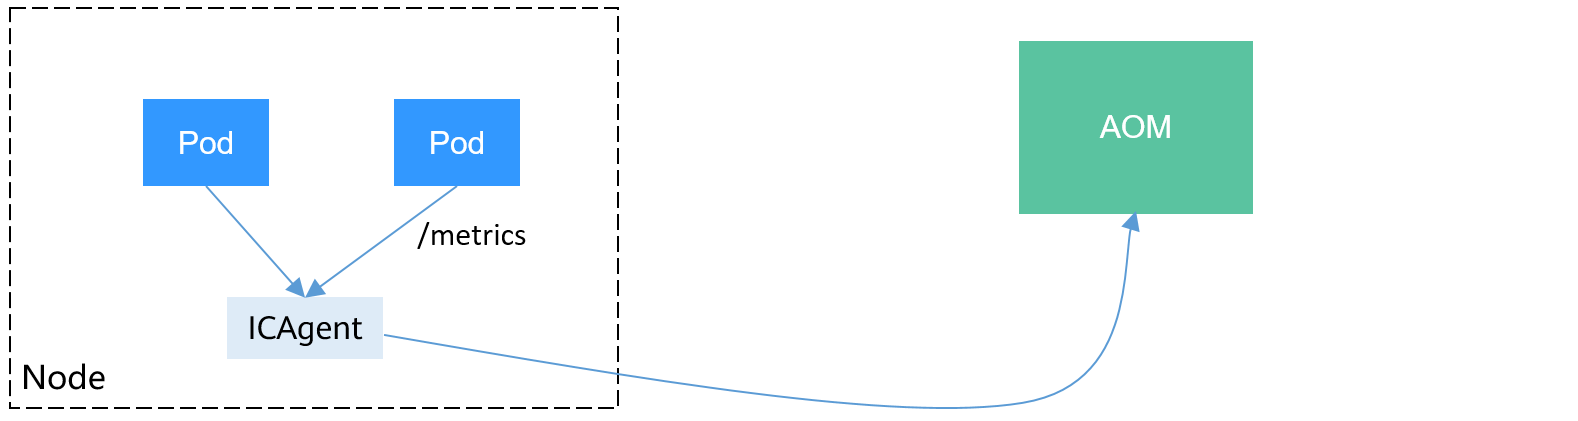
CCE allows you to upload custom metrics to AOM. The ICAgent on a node periodically calls the metric monitoring API configured on a workload to read monitoring data and then uploads the data to AOM.
The custom metric API of a workload can be configured when the workload is created. This section uses an Nginx application as an example to describe how to report custom metrics to AOM.
Notes and Constraints
The ICAgent is compatible with the monitoring data specifications of Prometheus. The custom metrics provided by pods can be collected by the ICAgent only when they meet the monitoring data specifications of Prometheus.
The ICAgent supports only Gauge metrics.
The interval for the ICAgent to call the custom metric API is 1 minute, which cannot be changed.
Prometheus Monitoring Data Collection
Prometheus periodically calls the metric monitoring API (/metrics by default) of an application to obtain monitoring data. The application needs to provide the metric monitoring API for Prometheus to call, and the monitoring data must meet the following specifications of Prometheus:
# TYPE nginx_connections_active gauge
nginx_connections_active 2
# TYPE nginx_connections_reading gauge
nginx_connections_reading 0
Prometheus provides clients in various languages. For details about the clients, see Prometheus CLIENT LIBRARIES. For details about how to develop an exporter, see WRITING EXPORTERS. The Prometheus community provides various third-party exporters that can be directly used. For details, see EXPORTERS AND INTEGRATIONS.
Preparing an Application
Nginx has a module named ngx_http_stub_status_module, which provides basic monitoring functions. You can configure the nginx.conf file to provide an API for external systems to access Nginx monitoring data. As shown in the following figure, after the server configuration is added to http, Nginx can provide an API for external systems to access Nginx monitoring data.
user  nginx;
worker_processes  auto;

error_log  /var/log/nginx/error.log warn;
pid        /var/run/nginx.pid;

events {
    worker_connections  1024;
}

http {
    include       /etc/nginx/mime.types;
    default_type  application/octet-stream;
    log_format  main  '$remote_addr - $remote_user [$time_local] "$request" '
                      '$status $body_bytes_sent "$http_referer" '
                      '"$http_user_agent" "$http_x_forwarded_for"';

    access_log  /var/log/nginx/access.log  main;
    sendfile        on;
    #tcp_nopush     on;
    keepalive_timeout  65;
    #gzip  on;
    include /etc/nginx/conf.d/*.conf;

    server {
      listen 8080;
      server_name  localhost;
      location /stub_status {
         stub_status on;
         access_log off;
      }
    }
}
Save the preceding configuration to the nginx.conf file and use the configuration to create a new image. The Dockerfile file is as follows:
FROM nginx:1.21.5-alpine
ADD nginx.conf /etc/nginx/nginx.conf
EXPOSE 80
CMD ["nginx", "-g", "daemon off;"]
Use the preceding Dockerfile file to build an image and upload it to SWR. The image name is nginx:exporter.
docker build -t nginx:exporter .
docker tag nginx:exporter {swr-address}/{group}/nginx:exporter
docker push {swr-address}/{group}/nginx:exporter
After running a container with image nginx:exporter, you can obtain Nginx monitoring data by calling http://<ip_address>:8080/stub_status. < ip_address > indicates the IP address of the container. The monitoring data is as follows:
# curl http://127.0.0.1:8080/stub_status
Active connections: 3
server accepts handled requests
 146269 146269 212
Reading: 0 Writing: 1 Waiting: 2
Deploying an Application
The data format of the monitoring data provided by nginx:exporter does not meet the requirements of Prometheus. You need to convert the data format to the format required by Prometheus. To convert the format of Nginx metrics, use nginx-prometheus-exporter, as shown in the following figure.
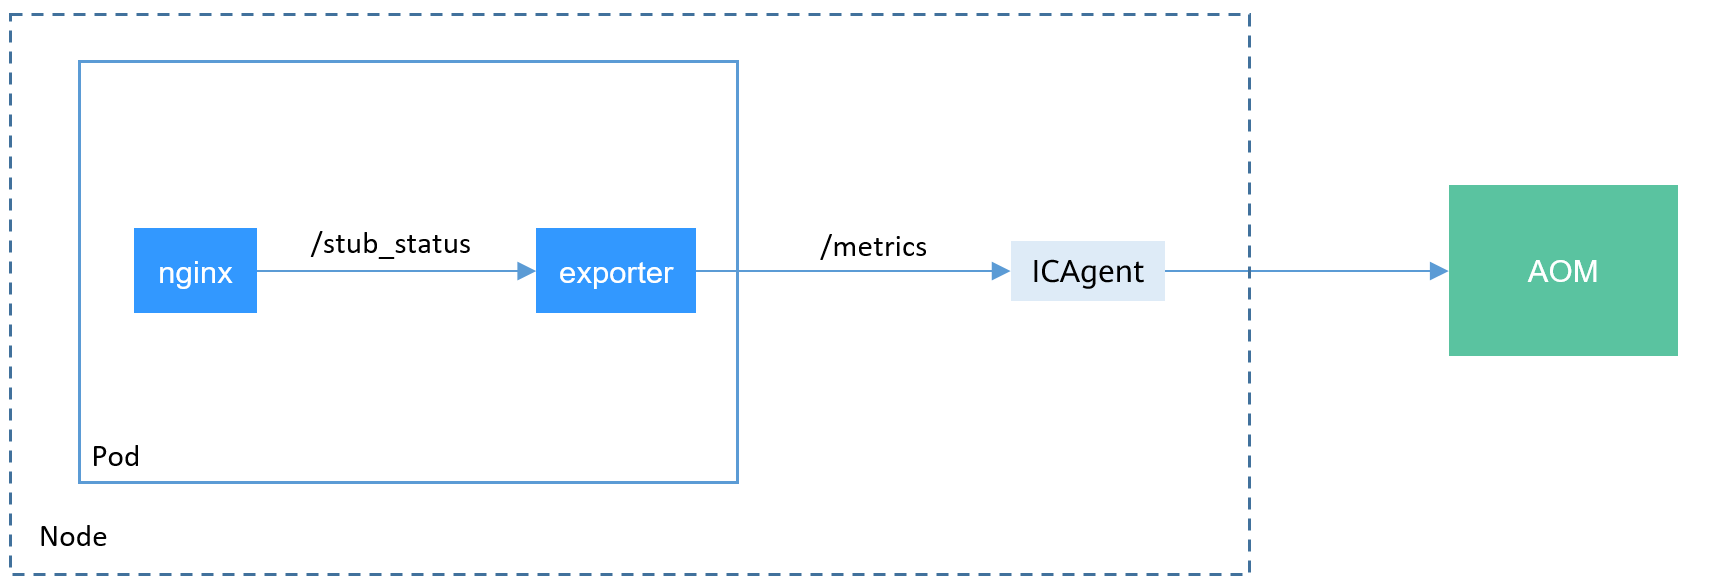
Deploy nginx:exporter and nginx-prometheus-exporter in the same pod.
kind: Deployment
apiVersion: apps/v1
metadata:
  name: nginx-exporter
  namespace: default
spec:
  replicas: 1
  selector:
    matchLabels:
      app: nginx-exporter
  template:
    metadata:
      labels:
        app: nginx-exporter
      annotations:
        metrics.alpha.kubernetes.io/custom-endpoints: '[{"api":"prometheus","path":"/metrics","port":"9113","names":""}]'
    spec:
      containers:
        - name: container-0
          image: 'nginx:exporter'  # Replace it with the address of the image you uploaded to SWR.
          resources:
            limits:
              cpu: 250m
              memory: 512Mi
            requests:
              cpu: 250m
              memory: 512Mi
        - name: container-1
          image: 'nginx/nginx-prometheus-exporter:0.9.0'
          command:
            - nginx-prometheus-exporter
          args:
            - '-nginx.scrape-uri=http://127.0.0.1:8080/stub_status'
      imagePullSecrets:
        - name: default-secret
Note
The nginx/nginx-prometheus-exporter:0.9.0 image needs to be pulled from the public network. Therefore, each node in the cluster must have a public IP address.
nginx-prometheus-exporter requires a startup command. nginx-prometheus-exporter -nginx.scrape-uri=http://127.0.0.1:8080/stub_status is used to obtain Nginx monitoring data.
In addition, you need to add an annotation metrics.alpha.kubernetes.io/custom-endpoints: '[{"api":"prometheus","path":"/metrics","port":"9113","names":""}]' to the pod.
Verification
After an application is deployed, you can access Nginx to construct some access data and check whether the corresponding monitoring data can be obtained in AOM.
$ kubectl get pod
NAME                              READY   STATUS    RESTARTS   AGE
nginx-exporter-78859765db-6j8sw   2/2     Running   0          4m
$ kubectl exec -it nginx-exporter-78859765db-6j8sw -- /bin/sh
Defaulting container name to container-0.
Use 'kubectl describe pod/nginx-exporter-78859765db-6j8sw -n default' to see all of the containers in this pod.
/ # curl http://localhost
<!DOCTYPE html>
<html>
<head>
<title>Welcome to nginx!</title>
<style>
html { color-scheme: light dark; }
body { width: 35em; margin: 0 auto;
font-family: Tahoma, Verdana, Arial, sans-serif; }
</style>
</head>
<body>
<h1>Welcome to nginx!</h1>
<p>If you see this page, the nginx web server is successfully installed and
working. Further configuration is required.</p>

<p>For online documentation and support please refer to
<a href="http://nginx.org/">nginx.org</a>.<br/>
Commercial support is available at
<a href="http://nginx.com/">nginx.com</a>.</p>

<p><em>Thank you for using nginx.</em></p>
</body>
</html>
/ #
You can see that Nginx has been accessed once.
Log in to AOM. In the navigation pane, choose Monitoring > Metric Monitoring. You can view Nginx-related metrics, for example, nginx_connections_active.