Querying CTS Logs
Scenario
After you enable CTS, the system starts recording operations on CCE resources. Operation records of the last 7 days can be viewed on the CTS management console.
Procedure
Log in to the management console.
Click
 in the upper left corner and select a region.
Choose Service List from the main menu. Choose Management & Deployment > Cloud Trace Service.
In the navigation pane of the CTS console, choose Cloud Trace Service > Trace List.
On the Trace List page, query operation records based on the search criteria. Currently, the trace list supports trace query based on the combination of the following search criteria:
Trace Source, Resource Type, and Search By
Select the search criteria from the drop-down lists. Select CCE from the Trace Source drop-down list.
If you select Trace name from the Search By drop-down list, specify the trace name.
If you select Resource ID from the Search By drop-down list, select or enter a specific resource ID.
If you select Resource name from the Search By drop-down list, select or enter a specific resource name.
Operator: Select a specific operator (at user level rather than account level).
Trace Status: Set this parameter to any of the following values: All trace statuses, normal, warning, and incident.
Time range: You can query traces generated during any time range in the last seven days.
Click
 on the left of a trace to expand its details, as shown below.
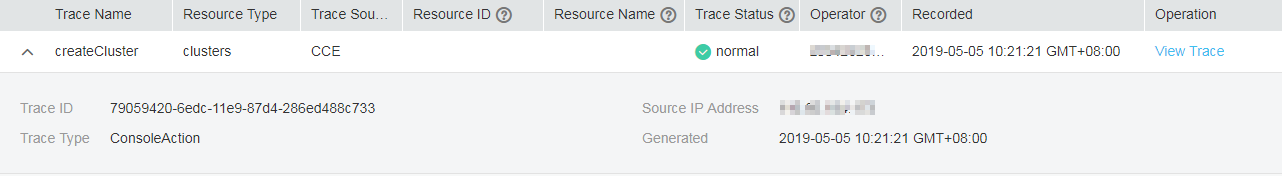
Figure 1 Expanding trace details
Click View Trace in the Operation column. The trace details are displayed.
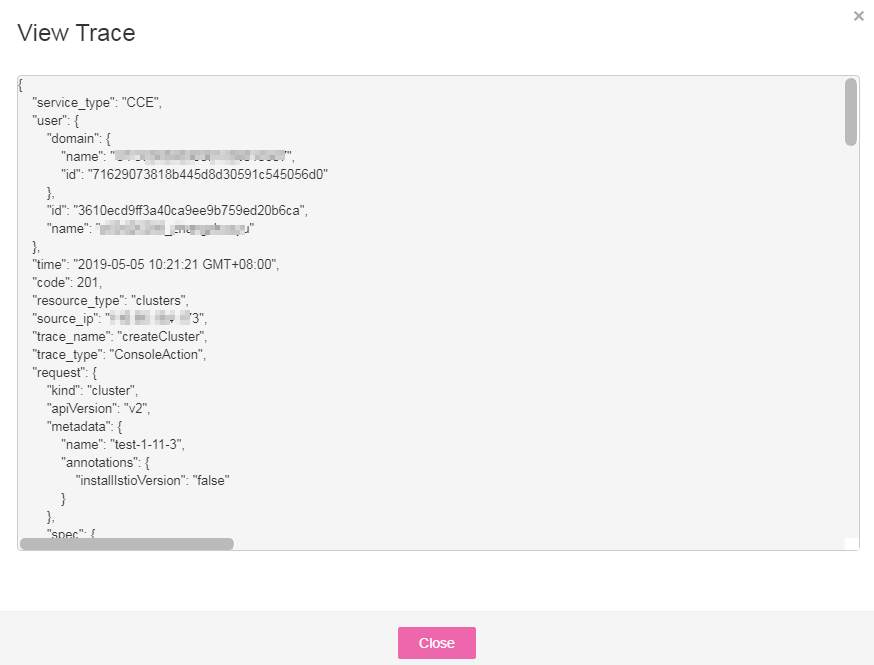
Figure 2 Viewing event details